Mastering Multi-Table Data Integration
Strategies for Seamless Analysis and Management
I've spent years working with data across organizations of all sizes, and one challenge consistently emerges: effectively integrating and analyzing data spread across multiple tables. As data environments have grown more complex, the traditional approaches of manual joins and siloed analyses no longer suffice. In this comprehensive guide, I'll walk you through the strategies that have helped me transform fragmented data into cohesive, actionable insights.
Whether you're a data analyst struggling with complex relationships, a business intelligence specialist trying to create unified dashboards, or a data architect designing robust integration systems, this guide will provide practical approaches to streamline your multi-table data management and unlock powerful analytical capabilities.
The Evolution of Data Integration Challenges
When I first started working with data analytics, most business questions could be answered with a single table or spreadsheet. Today, the landscape has dramatically shifted. Modern data environments span dozens or even hundreds of interconnected tables across multiple systems.

Key Pain Points in Traditional Approaches
The rising complexity of data relationships creates significant challenges. In my work with enterprise clients, I've seen how fragmented data directly impacts business performance:
- Delayed decision-making due to time spent reconciling data across tables
- Inconsistent reporting from different teams using different join methodologies
- Missed insights when relationships between data entities aren't properly established
- Increased technical debt from ad-hoc integration solutions
- Reduced trust in data when analyses from related tables don't align
These challenges have pushed organizations to rethink their entire approach to data integration, moving from manual processes toward more systematic, scalable strategies that I'll explore throughout this guide.
Fundamental Multi-Table Integration Architectures
In my experience implementing data integration solutions, I've found that choosing the right architecture is fundamental. Let's examine the key approaches and when each makes the most sense.
ETL vs. ELT Approaches
                    flowchart LR
                        subgraph "ETL Process"
                            E1[Extract] --> T1[Transform]
                            T1 --> L1[Load]
                        end
                        subgraph "ELT Process"
                            E2[Extract] --> L2[Load]
                            L2 --> T2[Transform]
                        end
                        DB1[(Source DB)] --> E1
                        DB2[(Source DB)] --> E2
                        L1 --> DW1[(Data Warehouse)]
                        T2 --> DW2[(Data Warehouse)]
                        style ETL fill:#FF8000,color:white
                        style ELT fill:#FF9A3C,color:white
When dealing with complex multi-table environments, the choice between ETL (Extract, Transform, Load) and ELT (Extract, Load, Transform) significantly impacts how relationships are handled. I typically recommend ETL for scenarios requiring extensive data cleansing before integration, while ELT works better for data lake environments where you want to preserve raw data relationships for future exploration.
Data Modeling Approaches
Star Schema
                            flowchart TD
                                F[Fact Table] --- D1[Dimension 1]
                                F --- D2[Dimension 2]
                                F --- D3[Dimension 3]
                                F --- D4[Dimension 4]
                                style F fill:#FF8000,color:white
                                style D1 fill:#FFB366,color:black
                                style D2 fill:#FFB366,color:black
                                style D3 fill:#FFB366,color:black
                                style D4 fill:#FFB366,color:black
Optimized for query performance with direct relationships to a central fact table.
Snowflake Schema
                            flowchart TD
                                F[Fact Table] --- D1[Dimension 1]
                                F --- D2[Dimension 2]
                                D1 --- SD1[Sub-Dimension 1]
                                D2 --- SD2[Sub-Dimension 2]
                                style F fill:#FF8000,color:white
                                style D1 fill:#FFB366,color:black
                                style D2 fill:#FFB366,color:black
                                style SD1 fill:#FFCC99,color:black
                                style SD2 fill:#FFCC99,color:black
Better normalization with hierarchical dimension relationships at the cost of query complexity.
I've found that star schemas generally work best for business intelligence applications where query performance is critical, while snowflake schemas excel in scenarios where storage efficiency and data normalization are priorities. The right choice depends on your specific analytical requirements and data volume.
Virtual vs. Physical Integration
In my projects, I've increasingly adopted hybrid approaches that leverage the strengths of both physical integration (for stable, performance-critical data relationships) and virtual integration (for exploratory analysis and rapidly changing data). This balanced strategy provides the flexibility modern data environments demand.
Advanced Techniques for Seamless Table Relationships
Establishing robust relationships between tables is where I see many integration projects succeed or fail. Let's explore the techniques I've found most effective for creating seamless connections across data sources.
Effective Key Strategies

When designing key relationships, I follow these principles:
- Use natural keys when they're stable and meaningful (e.g., ISO country codes)
- Implement surrogate keys for performance and to isolate from source system changes
- Create composite keys when necessary, but be mindful of join performance
- Document key relationships thoroughly to support future data model evolution
Mastering Join Operations
                    flowchart TD
                        subgraph "Join Types"
                            I[Inner Join] --- L[Left Join]
                            I --- R[Right Join]
                            I --- F[Full Outer Join]
                            I --- C[Cross Join]
                        end
                        subgraph "Table A"
                            A1[Record 1]
                            A2[Record 2]
                            A3[Record 3]
                        end
                        subgraph "Table B"
                            B1[Record 1]
                            B2[Record 2]
                            B4[Record 4]
                        end
                        A1 -.- B1
                        A2 -.- B2
                        style I fill:#FF8000,color:white
                        style L fill:#FFB366,color:black
                        style R fill:#FFB366,color:black
                        style F fill:#FFB366,color:black
                        style C fill:#FFB366,color:black
The right join strategy can dramatically impact both performance and results. I've learned that understanding the data distribution across tables is crucial before choosing between inner, left, right, or full outer joins. For analytical queries spanning multiple fact tables, I often use a technique I call "selective denormalization" where I pre-join commonly accessed dimensions to improve query performance.
Normalization and Denormalization Balance
Finding the right balance between normalization and denormalization has been crucial in my projects. I typically maintain a normalized core data model for transactional systems while creating purpose-built denormalized views for specific analytical needs. This hybrid approach preserves data integrity while optimizing for query performance.
Handling Hierarchical and Temporal Data
Two particularly challenging aspects of multi-table integration are hierarchical relationships and temporal data. For hierarchical data, I've had success with techniques like adjacency lists for simple hierarchies and materialized path approaches for more complex structures. For temporal data integration, I ensure that all related tables use consistent time dimensions and granularity to avoid misaligned analyses.
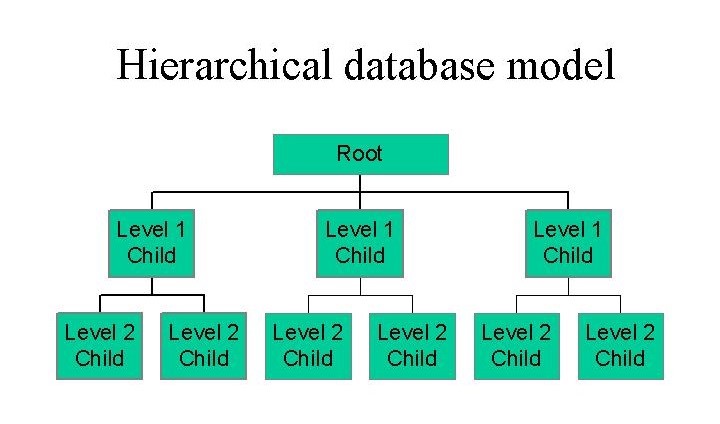
Transforming Multi-Table Data into Visual Insights
Having well-integrated data is only half the battle—the real value emerges when we can visualize relationships and insights across tables. In my experience, this is where many organizations struggle but also where the greatest opportunities lie.
Visualization Approaches for Related Tables
Effective data visualization tools can transform complex multi-table relationships into intuitive visual stories. I've found that different relationship types benefit from specific visualization approaches:
One-to-Many Relationships
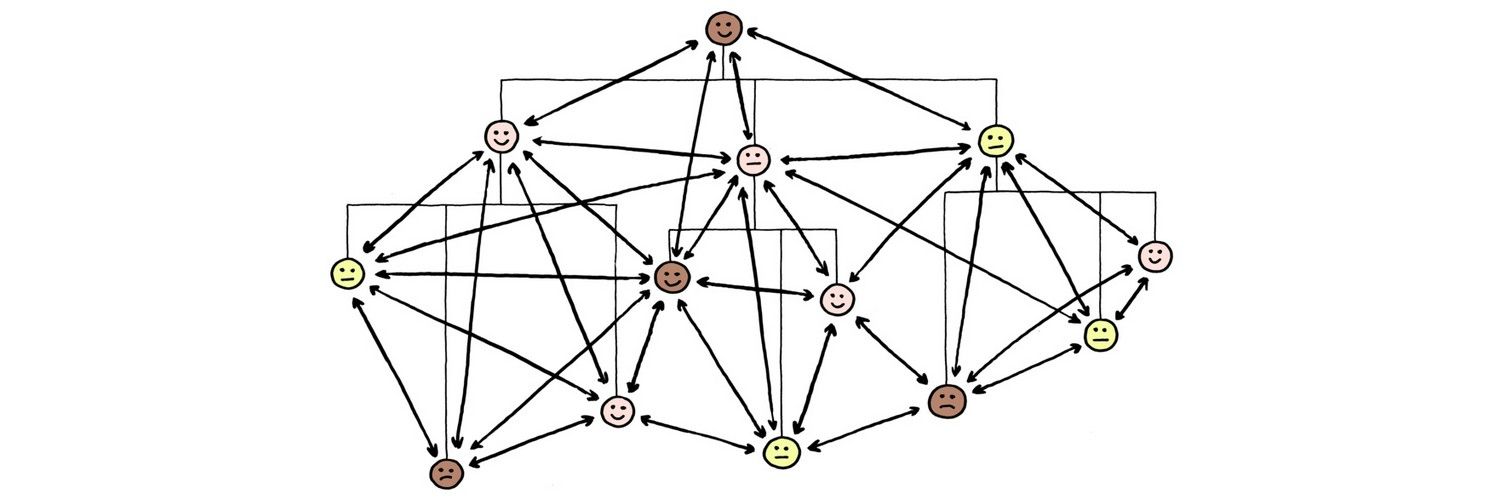
Best visualized with hierarchical displays like tree diagrams or nested tables.
Many-to-Many Relationships
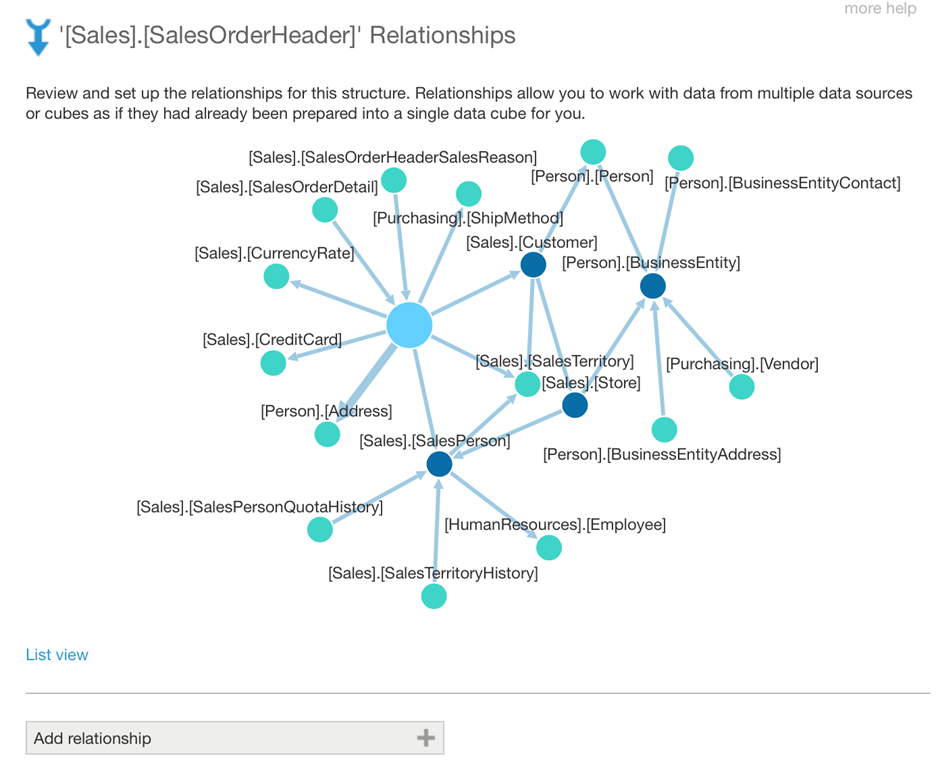
Network graphs and matrix visualizations effectively show complex interconnections.
Time-Based Relationships
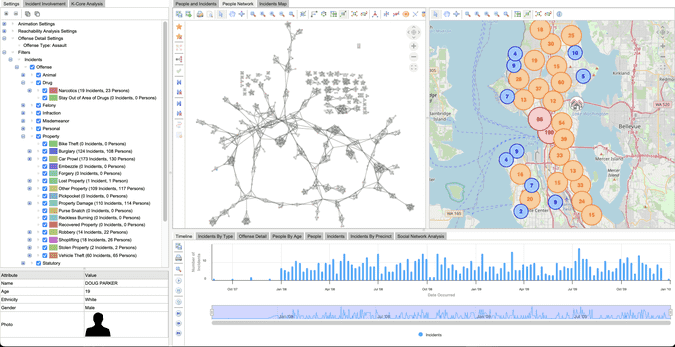
Timelines and Gantt charts reveal temporal patterns across related tables.
Creating interactive visualizations for data exploration has been transformative in my projects. When users can dynamically explore relationships between tables—filtering, drilling down, and pivoting on demand—they discover insights that would remain hidden in static reports.
Building Integrated Dashboards

The most effective dashboards I've designed follow these principles for multi-table data:
- Maintain consistent entity definitions across all visualizations
- Use synchronized filtering to maintain context across related views
- Include relationship indicators that show how visualizations connect
- Provide drill-down capabilities to explore hierarchical relationships
- Use color and visual cues consistently to represent entities across tables
I've found that PageOn.ai's AI Blocks feature is particularly powerful for mapping complex table relationships without requiring technical expertise. The visual mapping interface allows business users to create sophisticated relationship visualizations that would traditionally require database expertise.
From Data to Business Intelligence
Implementing data visualization for business intelligence that spans multiple tables requires thoughtful design. The most successful implementations I've led focus on telling a cohesive story across related data sets rather than presenting isolated metrics.
Real-Time Data Integration Strategies
As businesses increasingly demand real-time insights, I've had to evolve my integration strategies beyond batch processing. Here are the approaches I've found most effective for real-time multi-table integration.
Streaming Data Integration
                    flowchart LR
                        S1[(Source 1)] --> KS[Kafka Stream]
                        S2[(Source 2)] --> KS
                        S3[(Source 3)] --> KS
                        KS --> P[Processing]
                        P --> ST[Stream Tables]
                        P --> M[Materialized Views]
                        ST --> A[Analytics]
                        M --> A
                        style KS fill:#FF8000,color:white
                        style P fill:#FFB366,color:black
                        style ST fill:#FFCC99,color:black
                        style M fill:#FFCC99,color:black
Streaming data integration presents unique challenges when maintaining relationships across tables. I've implemented successful stream processing architectures using technologies like Kafka Streams and Flink that maintain state across related data streams and ensure referential integrity even with high-velocity data.
Change Data Capture
Change Data Capture (CDC) has been invaluable in my projects for maintaining synchronized views across related tables. By capturing changes at the source and propagating them through the integration pipeline, we ensure that relationships remain consistent across all downstream systems.

API-Driven Integration
For many modern applications, I've moved away from direct database integration toward API-driven approaches. This strategy is particularly effective when working with SaaS platforms and microservices, as it respects the encapsulation of each system while still enabling real-time data relationships.
I've found GraphQL particularly valuable for multi-table integration scenarios because it allows clients to specify exactly which related data they need in a single request, reducing the complexity of managing relationships across multiple API calls.
Event-Based Architectures
Event-driven integration has become my preferred approach for complex, real-time multi-table scenarios. By modeling business events that span multiple entities, we can maintain a cohesive view of related data even when the underlying tables are distributed across different systems.
PageOn.ai's Deep Search capability has been particularly useful in these environments, as it can automatically discover and integrate related data points across tables without requiring explicit mapping of every relationship. This AI-driven approach adapts to changing data structures and discovers new relationships that might otherwise be missed.
Overcoming Common Multi-Table Integration Challenges
Throughout my career implementing data integration solutions, I've encountered recurring challenges when working with multiple tables. Here are the strategies I've developed to address them effectively.
Resolving Data Quality Issues

Data quality issues compound when working across multiple tables. I address this by:
- Implementing cross-table validation rules that verify relationship integrity
- Creating data quality scorecards that track issues by table and relationship
- Developing automated reconciliation processes for key reference data
- Establishing data quality SLAs for each integration point
Managing Schema Evolution
Schema changes in one table can ripple through an entire integration ecosystem. My approach to managing this includes:
                    flowchart TD
                        SC[Schema Change] --> IA[Impact Analysis]
                        IA --> TR[Table Relationships Review]
                        IA --> DL[Downstream Lineage]
                        TR --> MP[Migration Plan]
                        DL --> MP
                        MP --> VT[Versioned Transformation]
                        MP --> CD[Coordinated Deployment]
                        VT --> PM[Post-Migration Validation]
                        CD --> PM
                        style SC fill:#FF8000,color:white
                        style MP fill:#FFB366,color:black
                        style PM fill:#FFCC99,color:black
I've found that maintaining comprehensive data lineage documentation is critical for managing schema evolution in multi-table environments. When we understand how data flows between tables and systems, we can better predict and mitigate the impact of changes.
Handling Missing Relationships
Orphaned data and missing relationships are inevitable in complex environments. My strategies include:
- Implementing "soft relationships" using fuzzy matching for records lacking exact key matches
- Creating relationship confidence scores to indicate match quality
- Developing fallback hierarchies for relationship resolution
- Building automated monitoring for orphaned record detection
Performance Optimization
Performance optimization for multi-table queries requires a holistic approach. In my projects, materialized views have consistently delivered the greatest performance improvements for complex analytical queries spanning multiple tables.
Simplifying Complex Relationships
Creating interactive data visualization tools that simplify complex relationships has been transformative in my projects. PageOn.ai's visualization capabilities have allowed me to create intuitive interfaces that abstract away the underlying complexity of multi-table relationships, making the data accessible to business users regardless of their technical expertise.
Case Studies: Multi-Table Integration Success Stories
Through my career, I've had the opportunity to implement multi-table integration solutions across various industries. These case studies illustrate the approaches that delivered the most significant business value.
Financial Services: Comprehensive Customer Analysis
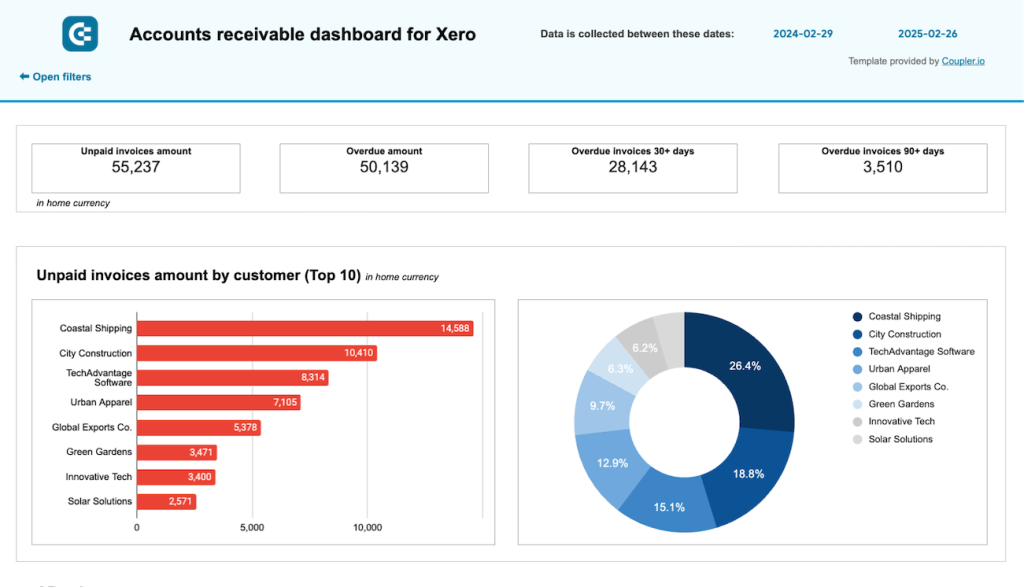
For a major financial institution, I designed an integration solution that connected customer profiles, transaction history, product holdings, and risk assessments into a unified view. The key challenges included:
- Reconciling customer identities across legacy systems with inconsistent keys
- Maintaining transaction integrity while joining with reference data
- Creating a real-time view of customer activity across products
Our solution implemented a customer master data hub with probabilistic matching algorithms and created a real-time event stream that maintained relationships between transactions and customer profiles. The resulting unified dashboard increased cross-sell opportunities by 28% and improved risk assessment accuracy by 15%.
Healthcare: Connected Patient Journey
For a healthcare provider network, I developed an integration architecture that connected patient records, treatment data, lab results, and outcomes across previously siloed systems. The solution:
- Created a longitudinal patient record that preserved relationships between diagnoses, treatments, and outcomes
- Implemented privacy-preserving integration patterns that maintained HIPAA compliance
- Developed temporal alignment algorithms to correctly sequence events from different systems
                    flowchart TD
                        PR[Patient Records] --- TD[Treatment Data]
                        PR --- LR[Lab Results]
                        TD --- OD[Outcomes Data]
                        LR --- OD
                        PR --> PJ[Patient Journey]
                        TD --> PJ
                        LR --> PJ
                        OD --> PJ
                        PJ --> CA[Clinical Analytics]
                        PJ --> QI[Quality Improvement]
                        PJ --> RP[Research Platform]
                        style PR fill:#FF8000,color:white
                        style TD fill:#FF8000,color:white
                        style LR fill:#FF8000,color:white
                        style OD fill:#FF8000,color:white
                        style PJ fill:#FFB366,color:black
The integrated patient journey visualization reduced treatment planning time by 35% and improved outcome prediction accuracy by 22%.
E-commerce: Unified Customer Experience
For an omnichannel retailer, I designed a data integration platform that unified product data, customer profiles, behavioral analytics, and inventory information. The solution featured:
The integration enabled personalized recommendations based on a holistic customer view, resulting in a 62% increase in conversion rate and a 35% improvement in customer retention.
Manufacturing: Operational Excellence
For a global manufacturer, I implemented a multi-table integration solution that connected production data, quality measurements, supply chain information, and customer feedback. Using PageOn.ai's Vibe Creation features, we transformed this complex data landscape into visual narratives that highlighted operational bottlenecks and quality improvement opportunities, resulting in a 12% reduction in defect rates and 8% improvement in on-time delivery.
Future Trends in Multi-Table Data Integration
As I look to the future of multi-table data integration, several emerging technologies and approaches promise to transform how we connect and analyze related data.
AI-Driven Relationship Discovery
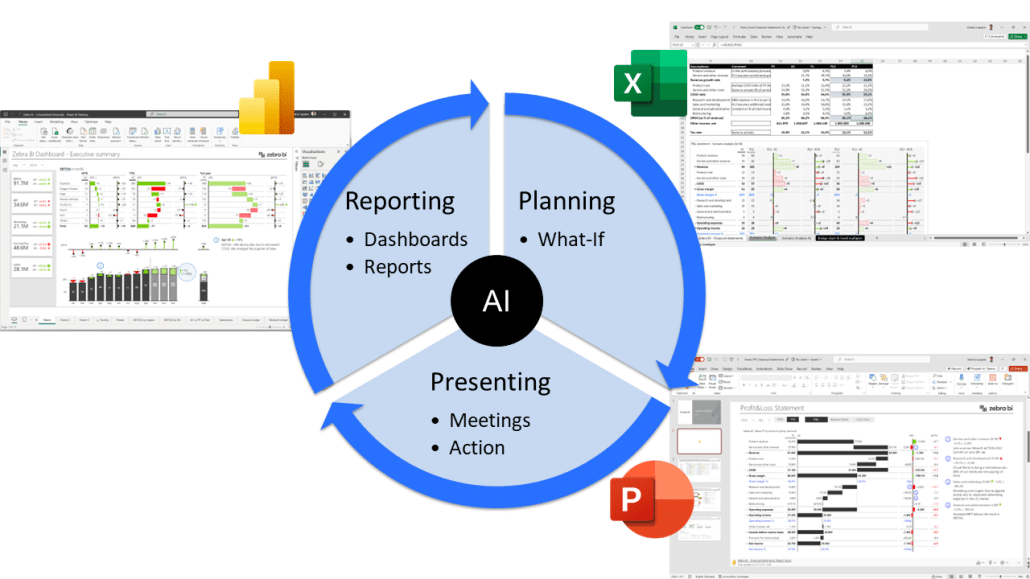
AI-powered relationship discovery is already beginning to automate what has traditionally been a manual, expertise-driven process. In my recent projects, I've seen machine learning algorithms successfully:
- Identify potential foreign key relationships based on data patterns
- Suggest join paths across complex schemas
- Detect anomalies in established relationships
- Recommend optimal table structures based on query patterns
As these technologies mature, I expect them to dramatically reduce the time required to integrate new data sources and maintain existing relationships.
Automated Data Lineage
                    flowchart LR
                        S1[(Source 1)] --> T1[Transform 1]
                        S2[(Source 2)] --> T1
                        T1 --> I1[Intermediate 1]
                        I1 --> T2[Transform 2]
                        S3[(Source 3)] --> T2
                        T2 --> F1[Final Table 1]
                        T2 --> F2[Final Table 2]
                        style T1 fill:#FF8000,color:white
                        style T2 fill:#FF8000,color:white
                        style I1 fill:#FFB366,color:black
Automated data lineage tracking is revolutionizing how we understand relationships across tables and transformations. These systems capture metadata about how data moves and transforms across the integration landscape, enabling:
- Impact analysis for proposed changes to source tables
- Root cause analysis when data quality issues arise
- Regulatory compliance documentation
- Self-service discovery of related data assets
Graph Database Approaches
I'm increasingly turning to graph databases for complex relationship modeling. Unlike traditional relational databases, graph databases are purpose-built for managing and querying relationships, offering significant advantages for certain multi-table integration scenarios:
Metadata Management Revolution
Advanced metadata management is becoming central to successful multi-table integration. Modern metadata platforms go beyond simple data dictionaries to provide:
- Semantic relationship modeling between business concepts
- Automated metadata extraction from data assets
- Governance workflows integrated with data integration processes
- AI-assisted data classification and relationship mapping
Beyond Traditional Boundaries
Creating impactful data visualizations that transcend traditional table boundaries will be a key differentiator in the coming years. I'm particularly excited about how PageOn.ai is enabling this transformation by automatically discovering and visualizing relationships that would be difficult to detect through traditional means. This AI-driven approach to visualization is opening new possibilities for understanding complex data ecosystems.
Building a Sustainable Multi-Table Integration Strategy
Based on my experience implementing integration solutions across organizations of all sizes, I've developed a framework for building sustainable multi-table integration strategies that evolve with business needs.
Data Governance for Cross-Table Relationships

Effective governance is the foundation of sustainable integration. I recommend establishing:
- Clear ownership for each data domain and the relationships between them
- Formal processes for reviewing and approving relationship changes
- Data quality SLAs that address relationship integrity
- Regular audits of key relationship paths
Master Data Management
Master data management (MDM) provides the consistent entity definitions needed for reliable multi-table integration. My approach to MDM focuses on:
                    flowchart TD
                        S1[(Source 1)] --> M[MDM Hub]
                        S2[(Source 2)] --> M
                        S3[(Source 3)] --> M
                        M --> G[Golden Record]
                        G --> D1[Dimension 1]
                        G --> D2[Dimension 2]
                        G --> D3[Dimension 3]
                        style M fill:#FF8000,color:white
                        style G fill:#FFB366,color:black
I've found that starting with the most critical business entities (customers, products, locations) and gradually expanding the MDM scope delivers the best results. The key is to ensure that these master entities can be reliably linked to transactional and analytical data across all integrated tables.
Integration Patterns and Reusable Components
Developing a library of integration patterns and reusable components accelerates implementation and ensures consistency. The patterns I've found most valuable include:
Change Data Propagation
Templates for capturing and propagating changes across related tables while maintaining referential integrity.
Entity Resolution
Standardized approaches for matching records across tables without perfect key relationships.
Temporal Alignment
Patterns for aligning data from different tables with inconsistent time dimensions.
Hierarchical Aggregation
Reusable components for rolling up metrics through hierarchical relationships.
Training Teams on Relational Data Thinking
Technical solutions alone aren't enough—team capabilities are equally important. I've developed training programs that help teams think relationally about data, covering:
- Data modeling fundamentals for business and technical teams
- Best practices for defining and documenting relationships
- Techniques for validating relationship integrity
- Approaches for visualizing complex relationships effectively
Evolving Visual Representations
As data relationships change over time, visual representations must evolve accordingly. PageOn.ai's Agentic capabilities have been invaluable in my projects, automatically adapting visualizations as underlying data structures change. This AI-driven approach ensures that business users always have an up-to-date view of complex relationships without requiring constant manual updates to dashboards and reports.
Transform Your Visual Expressions with PageOn.ai
Ready to turn your complex multi-table data into clear, compelling visual stories? PageOn.ai's intuitive tools help you create stunning visualizations without technical expertise.
Start Creating with PageOn.ai TodayFinal Thoughts
Throughout my career working with data integration, I've learned that success lies not just in connecting tables but in creating meaningful relationships that drive business value. The strategies outlined in this guide have helped me transform fragmented data environments into cohesive analytical ecosystems.
As data environments continue to grow in complexity, the ability to effectively integrate and visualize multi-table relationships will become an even more critical competitive advantage. By combining sound architectural principles with modern tools like PageOn.ai, organizations can turn data complexity into clarity and insight.
I encourage you to assess your current integration approaches against the strategies we've explored and identify opportunities to enhance how you manage and visualize relationships across your data landscape. The journey toward seamless multi-table integration may be challenging, but the analytical capabilities it unlocks are well worth the effort.
You Might Also Like
Revolutionizing Market Entry Presentations with ChatGPT and Gamma - Strategic Impact Guide
Learn how to leverage ChatGPT and Gamma to create compelling market entry presentations in under 90 minutes. Discover advanced prompting techniques and visual strategies for impactful pitches.
Building New Slides from Prompts in Seconds | AI-Powered Presentation Creation
Discover how to create professional presentations instantly using AI prompts. Learn techniques for crafting perfect prompts that generate stunning slides without design skills.
Revolutionizing Slide Deck Creation: How AI Tools Transform Presentation Workflows
Discover how AI-driven tools are transforming slide deck creation, saving time, enhancing visual communication, and streamlining collaborative workflows for more impactful presentations.
Mastering Visual Flow: How Morph Transitions Transform Presentations | PageOn.ai
Discover how Morph transitions create dynamic, seamless visual connections between slides, enhancing audience engagement and transforming ordinary presentations into memorable experiences.
