Mastering Professional Diagram Customization
From Creation to Multi-Format Export
I've spent years refining my approach to professional diagrams, and I'm excited to share what I've learned about creating customized visuals that truly communicate. In this comprehensive guide, we'll explore everything from fundamental design principles to advanced export strategies that ensure your diagrams make an impact in any format.
Understanding Professional Diagram Fundamentals
In my experience working with technical teams and business stakeholders, I've found that professional diagrams serve as the universal language that bridges communication gaps. They transform complex concepts into digestible visual narratives that resonate with diverse audiences.

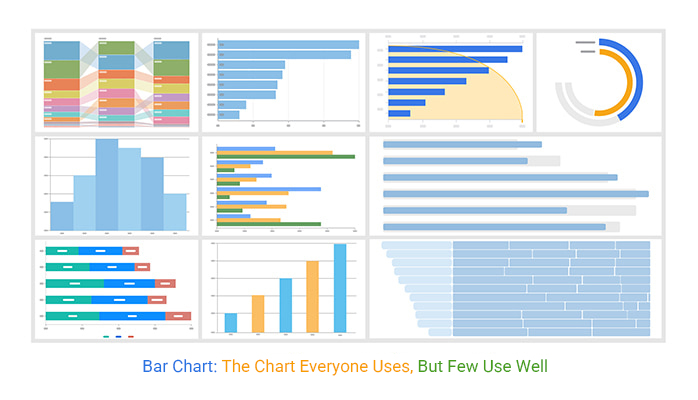
Various professional diagram types and their applications in business contexts
When exploring types of diagrams commonly used in professional settings, I've noticed that each serves a distinct purpose. Flowcharts map processes, organizational charts illustrate hierarchies, network diagrams show connections, and entity-relationship diagrams model data structures.
The power of customization cannot be overstated. When I tailor diagrams to specific audiences and contexts, I see immediate improvements in comprehension and engagement. A technical diagram customized for engineers will look drastically different from one designed for executive stakeholders, even when representing the same system.
flowchart TD
    A[Raw Information] -->|Analysis| B[Structured Content]
    B -->|Visualization| C[Basic Diagram]
    C -->|Customization| D[Professional Diagram]
    D -->|Format Selection| E[Export Options]
    style A fill:#FF8000,stroke:#333,stroke-width:1px,color:white
    style B fill:#FF9A3C,stroke:#333,stroke-width:1px
    style C fill:#FFB366,stroke:#333,stroke-width:1px
    style D fill:#FFCC99,stroke:#333,stroke-width:1px
    style E fill:#FFE6CC,stroke:#333,stroke-width:1px
The diagram creation process flow from raw information to export
I've learned that striking the right balance between visual appeal and information clarity is crucial. An aesthetically pleasing diagram that fails to convey information clearly is just as ineffective as a data-rich visualization that overwhelms the viewer. My approach focuses on enhancing comprehension through thoughtful design choices rather than adding decorative elements that distract from the core message.
Key Elements of Professional Diagram Customization
Throughout my career creating professional diagrams, I've identified several design principles that consistently yield effective results. Clean layouts with ample white space improve readability, while consistent visual hierarchy guides viewers through complex information in a logical sequence.
Color scheme selection is one of my most powerful customization tools. I've found that selecting colors that align with brand guidelines creates visual consistency across all company materials. Beyond branding, I use color strategically to establish visual hierarchy and draw attention to key elements. For technical diagrams that may be printed in black and white, I ensure that color differences translate well to grayscale.
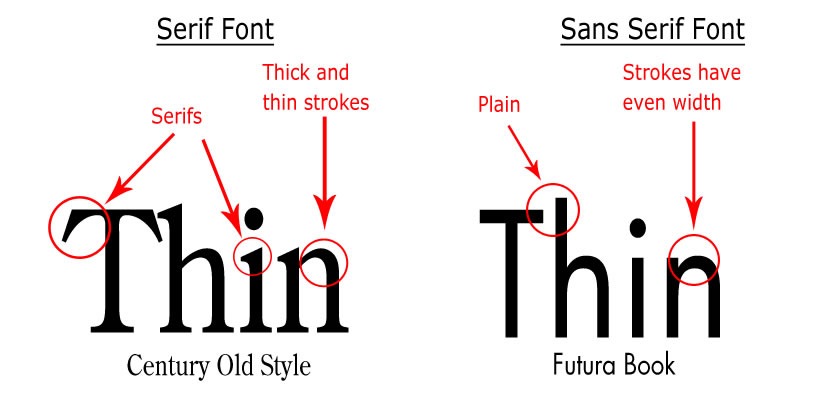
Typography choices significantly impact diagram readability across different export formats. I prefer sans-serif fonts like Arial or Helvetica for their clarity at various sizes. When working with diagrams that will be exported to multiple formats, I maintain consistent font usage and ensure text remains legible even when scaled down for presentations or mobile viewing.

Typography comparison for diagram readability across different export formats
Customizing connectors, shapes, and visual elements creates a consistent visual language throughout my diagrams. I've developed standardized shape libraries for different diagram types to maintain consistency across projects. For complex technical diagrams, I use AI chart generators to enhance diagram impact with data visualizations that complement the structural elements.
Advanced Customization Techniques for Specific Diagram Types
My approach to flowchart customization focuses on creating clear visual pathways. I use consistent arrow styles and thoughtful placement of decision points to guide the viewer's eye naturally through the process. Color coding different process types helps viewers quickly identify key stages and decision points.
flowchart TD
    A[Start Process] --> B{Decision Point}
    B -->|Option 1| C[Action Step]
    B -->|Option 2| D[Alternative Action]
    C --> E[Sub-Process]
    D --> F[Another Sub-Process]
    E --> G[Final Step]
    F --> G
    classDef orange fill:#FF8000,stroke:#333,stroke-width:1px,color:white
    classDef blue fill:#42A5F5,stroke:#333,stroke-width:1px
    classDef green fill:#66BB6A,stroke:#333,stroke-width:1px
    class A,G orange
    class B blue
    class C,D,E,F green
Customized flowchart with color-coded elements for improved visual clarity
When creating organizational charts, I personalize hierarchy representations while maintaining clarity. My technique involves using subtle size differences to denote hierarchy levels rather than dramatic changes that can make lower-level positions seem insignificant. I've found that horizontal organizational charts often work better for export to presentation formats like PowerPoint.
For comparison charts, I customize layouts to highlight key differentiators. The most effective comparison diagrams I've created use consistent visual metrics across all compared items and employ visual cues like checkmarks, x-marks, or color-coding to quickly communicate differences.
Technical diagrams present a unique challenge in balancing detail and readability. I use layering techniques to organize complex information, allowing viewers to focus on one system aspect at a time. For system architecture diagrams, I create custom iconography that represents components consistently across all related diagrams.
When working with logic models, I adapt templates for specific project needs while maintaining the core input-process-output structure. My customization approach focuses on making abstract concepts concrete through thoughtful visual metaphors that resonate with stakeholders' existing mental models.
Export Format Options and Their Applications
Understanding the strengths and limitations of different export formats has been crucial to my diagram workflow. Each format serves specific purposes in my professional communication toolkit.
| Format | Best For | Limitations | File Size |
|---|---|---|---|
| Documentation, printing, secure sharing | Limited editability | Medium | |
| PNG | Web use, presentations, screenshots | Raster format, scaling issues | Medium |
| SVG | Web graphics, responsive design | Complex editing, support issues | Small |
| PowerPoint | Presentations, animations | Format inconsistencies | Large |
| Interactive HTML | Web applications, tooltips, clickable elements | Requires web hosting | Varies |
I rely on PDF exports when maintaining visual fidelity and ensuring document security are priorities. PDFs preserve exact formatting across devices and platforms, making them ideal for formal documentation and client deliverables. For diagrams containing sensitive information, I leverage PDF security features like password protection and printing restrictions.
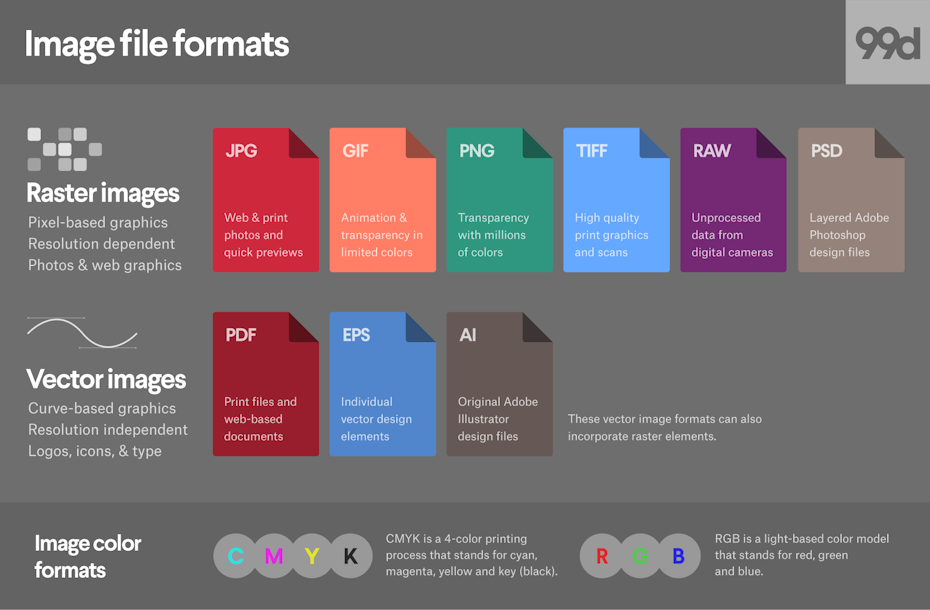
When working with image formats, I select the appropriate format based on the intended use. PNGs work well for web applications requiring transparency, while JPGs are my choice for photograph-rich diagrams where file size is a concern. For diagrams that need to scale across different display sizes, I prefer SVG format for its crisp rendering at any resolution.

Visual comparison of the same diagram exported in different formats
PowerPoint integration has become increasingly important in my workflow. Converting complex diagrams to presentation formats requires special attention to ensure they remain readable when projected. I've developed techniques for breaking down complex diagrams into sequential slides that build the complete picture incrementally, improving audience comprehension.
For interactive formats, I add clickable elements and embedded content to create engaging user experiences. These interactive diagrams excel in training materials and technical documentation, allowing users to explore complex systems at their own pace. However, I'm careful to ensure that printable versions maintain their utility without the interactive elements.
Accessibility considerations guide my export format decisions. I ensure that diagrams include appropriate text alternatives for screen readers and maintain sufficient color contrast for viewers with visual impairments. This attention to accessibility expands my diagram's reach and complies with increasingly common accessibility requirements.
Streamlining the Diagram Creation and Export Workflow
Over the years, I've refined my approach to diagram creation by setting up customization presets that maintain consistency. These presets include standardized color schemes, typography settings, connector styles, and shape libraries that align with brand guidelines while accelerating the creation process.
flowchart LR
    A[Create Master Templates] -->|Apply to| B[New Diagram]
    B --> C{Need Customization?}
    C -->|Yes| D[Apply Custom Elements]
    C -->|No| E[Use Template As-Is]
    D --> F[Save Custom Elements]
    E --> G[Export Process]
    F --> G
    G --> H[Batch Export to Formats]
    subgraph "Template Library"
    A
    F
    end
    style A fill:#FF8000,stroke:#333,stroke-width:1px,color:white
    style B fill:#FFB366,stroke:#333,stroke-width:1px
    style C fill:#42A5F5,stroke:#333,stroke-width:1px
    style D,E fill:#66BB6A,stroke:#333,stroke-width:1px
    style F fill:#FF8000,stroke:#333,stroke-width:1px,color:white
    style G fill:#FFB366,stroke:#333,stroke-width:1px
    style H fill:#FF8000,stroke:#333,stroke-width:1px,color:white
Efficient diagram creation and export workflow using templates and batch processing
Batch export techniques have revolutionized how I handle multi-format distribution requirements. When preparing diagrams for comprehensive documentation packages, I set up automated batch exports that generate all required formats simultaneously, saving significant time while ensuring consistency across all outputs.
Version control strategies are essential for diagrams requiring frequent updates. I implement clear naming conventions that include version numbers and dates, maintain a changelog documenting significant modifications, and archive previous versions rather than overwriting files. This disciplined approach prevents confusion when diagrams evolve over time.

Collaborative diagram customization with version tracking capabilities
Collaborative customization presents unique challenges in managing team input while maintaining design integrity. I've established clear roles and permissions within diagram creation tools, implemented approval workflows for significant changes, and created style guides that team members can reference when making modifications.
I've found that using AI-powered tools like PageOn.ai dramatically improves efficiency by automating repetitive customization tasks. The platform's intelligent templates adapt to specific content needs while maintaining visual consistency, allowing me to focus on strategic aspects of diagram design rather than manual formatting.
Case Studies: Successful Diagram Customization and Export Strategies
I recently worked with a tech company that transformed their technical documentation by implementing custom diagram templates. By standardizing their system architecture diagrams with consistent component representations and color-coding for different system types, they reduced diagram creation time by 40% while improving comprehension among new team members.
A marketing team I consulted with developed an approach to creating consistent brand-aligned visual assets. They established a diagram component library with pre-approved visual elements that maintained brand integrity while allowing for creative flexibility. This system enabled them to rapidly produce custom diagrams for campaigns while ensuring brand consistency across all customer touchpoints.
I've observed remarkable project management success through standardized yet flexible diagram frameworks. One product development team created a template system for their agile workflow visualization that adapted to different project phases while maintaining consistent visual language. This approach improved cross-functional communication and reduced misalignment between technical and business teams.

Executive presentation enhancement through strategically customized visuals
Executive presentations have been transformed through strategically customized visuals. I worked with a leadership team to develop simplified versions of complex operational diagrams that highlighted key insights without overwhelming detail. These executive-friendly visualizations improved decision-making speed and quality by focusing attention on critical metrics and relationships.
PageOn.ai's AI Blocks feature enabled my team to rapidly create complex system architecture diagrams for a client's cloud migration project. The intelligent component suggestions and automatic layout optimization reduced what would have been days of work into hours, while maintaining professional quality and consistency across dozens of related diagrams.
Future Trends in Professional Diagram Customization and Export
I'm particularly excited about AI-driven diagram suggestions based on content analysis. As this technology matures, we'll see tools that can analyze written specifications or requirements documents and generate initial diagram structures that serve as intelligent starting points for customization.

Emerging export formats for augmented reality diagram applications
Emerging export formats for augmented and virtual reality applications will transform how we interact with diagrams. I envision maintenance technicians using AR headsets to overlay system diagrams directly onto physical equipment, or training programs that allow users to "walk through" process flows in virtual environments.
Integration capabilities with evolving business intelligence platforms represent another frontier. The line between static diagrams and dynamic dashboards continues to blur, with diagram elements that can be linked to live data sources for real-time updates. This integration creates "living diagrams" that remain current without manual intervention.
flowchart TD
    A[Real-time Data Sources] -->|Feeds| B[AI Processing Layer]
    B -->|Updates| C[Dynamic Diagram Elements]
    D[User Interaction] -->|Triggers| E[Contextual Information]
    E -->|Enhances| C
    C -->|Exports to| F[Multiple Formats]
    C -->|Feeds back to| B
    subgraph "Intelligent Diagram Ecosystem"
    B
    C
    E
    end
    style A fill:#42A5F5,stroke:#333,stroke-width:1px
    style B fill:#FF8000,stroke:#333,stroke-width:1px,color:white
    style C fill:#66BB6A,stroke:#333,stroke-width:1px
    style D fill:#42A5F5,stroke:#333,stroke-width:1px
    style E fill:#FF8000,stroke:#333,stroke-width:1px,color:white
    style F fill:#66BB6A,stroke:#333,stroke-width:1px
Future intelligent diagram ecosystem with real-time updates and contextual information
Automation of diagram updates based on real-time data changes will become standard practice. I'm already seeing early implementations where system monitoring tools automatically update status indicators on infrastructure diagrams, or project management diagrams that reflect current task completion percentages without manual updates.
PageOn.ai's Deep Search functionality is revolutionizing how relevant visuals are integrated into diagrams. This AI-powered feature analyzes diagram context and suggests appropriate visual elements from vast libraries of icons, illustrations, and data visualizations. The technology learns from user selections, continuously improving its recommendations to align with individual preferences and industry-specific visual languages.
Transform Your Visual Expressions with PageOn.ai
Ready to revolutionize how you create, customize, and export professional diagrams? PageOn.ai combines powerful AI-driven tools with intuitive design capabilities to help you communicate complex ideas with clarity and impact.
Start Creating with PageOn.ai TodayConclusion: Mastering the Art of Professional Diagrams
Throughout this guide, I've shared my approach to creating customized professional diagrams that effectively communicate across multiple export formats. The power of thoughtful customization cannot be overstated—it transforms basic diagrams into strategic communication assets that drive understanding and decision-making.
As diagram creation tools continue to evolve, the balance between automation and customization becomes increasingly important. Tools like PageOn.ai are leading this evolution by providing intelligent assistance while preserving creative control, allowing professionals to focus on strategic communication rather than technical details.
I encourage you to experiment with the techniques we've explored, developing your own customization approach that balances visual appeal with information clarity. By mastering the art of professional diagram customization and understanding the strengths of different export formats, you'll create visual assets that truly elevate your professional communication.
You Might Also Like
Advanced Shape Effects for Professional Slide Design | Transform Your Presentations
Discover professional slide design techniques using advanced shape effects. Learn strategic implementation, customization, and optimization to create stunning presentations that engage audiences.
The Creative Edge: Harnessing Templates and Icons for Impactful Visual Design
Discover how to leverage the power of templates and icons in design to boost creativity, not restrict it. Learn best practices for iconic communication and template customization.
Beyond Bullet Points: Transform Your Text with Animated Visuals | PageOn.ai
Discover how to transform static bullet points into dynamic animated visuals that boost engagement by 40%. Learn animation fundamentals, techniques, and AI-powered solutions from PageOn.ai.
Revolutionizing Slide Deck Creation: How AI Tools Transform Presentation Workflows
Discover how AI-driven tools are transforming slide deck creation, saving time, enhancing visual communication, and streamlining collaborative workflows for more impactful presentations.
