Mastering the Art: Venture Capital vs Philanthropic Pitch Strategies
Understanding the Fundamental Differences Between Profit and Purpose-Driven Presentations
I've spent years analyzing how successful presenters tailor their pitches for different audiences. Whether you're seeking venture capital or philanthropic funding, the strategies that drive results couldn't be more different. In this guide, I'll walk you through the psychology, visual elements, and narrative techniques that make each pitch type effective.
Understanding the Fundamental Differences
When I first started working with entrepreneurs, I noticed that many struggled to adapt their pitches when switching between venture capital and philanthropic contexts. The truth is, these are fundamentally different conversations requiring distinct approaches to messaging, visuals, and metrics.
Core Objective Comparison
This diagram illustrates the fundamental differences in objectives between venture capital and philanthropic pitches:
                    flowchart TD
                        subgraph VC["Venture Capital Pitch"]
                            VC1[Financial Returns] --> VC2[Market Opportunity]
                            VC2 --> VC3[Scalable Business Model]
                            VC3 --> VC4[Exit Strategy]
                            VC4 --> VC5[ROI Projections]
                        end
                        subgraph PH["Philanthropic Pitch"]
                            PH1[Social Impact] --> PH2[Problem Statement]
                            PH2 --> PH3[Intervention Model]
                            PH3 --> PH4[Sustainability Plan]
                            PH4 --> PH5[Impact Metrics]
                        end
                        style VC fill:#FFF5E0,stroke:#FF8000
                        style PH fill:#F0F9FF,stroke:#0369A1
Audience Expectations
I've found that understanding your audience's primary motivations is crucial. Venture capitalists are primarily driven by potential returns, while philanthropic donors seek meaningful social impact. This fundamental difference shapes every aspect of your presentation strategy.
Timeline Perspectives
VC pitches typically focus on 3-5 year growth trajectories with clear exit strategies, while philanthropic pitches often address longer-term systemic change with sustainable impact models. When creating your startup pitch deck, timeline visualization becomes a critical element.
Audience Priority Comparison
The following chart illustrates the different priorities of venture capital investors versus philanthropic donors:
I've seen firsthand how PageOn.ai's Vibe Creation feature helps presenters quickly adapt their messaging for different audience types. By analyzing the core motivations of your audience, the tool can suggest visual themes, language patterns, and presentation structures that resonate with either profit-focused or purpose-driven stakeholders.
The Psychology Behind Successful Pitches
After studying hundreds of pitches, I've noticed distinct psychological triggers that drive decision-making in different funding contexts. Understanding these emotional drivers is essential for crafting presentations that resonate deeply with your audience.
VC Emotional Triggers
- Fear of missing out (FOMO) on the next big opportunity
- Confidence in predictable growth patterns
- Excitement about innovative disruption
- Trust in data-driven projections
- Competitive desire to outperform other investors
Philanthropic Emotional Triggers
- Empathy for those affected by the problem
- Desire to create meaningful legacy
- Alignment with personal values and identity
- Hope for transformative social change
- Satisfaction from direct impact visualization

The Data-Story Balance
One of the most critical differences I've observed is the balance between data and storytelling required in each context. While both elements are important, the emphasis shifts dramatically.
Data vs. Storytelling Balance
Finding the right balance between data and storytelling is crucial for each audience:
When creating a nonprofit pitch deck, I recommend leveraging personal stories that create emotional connection, while ensuring you still have the impact data to back up your claims. For venture pitches, lead with data but use targeted storytelling to make your market opportunity memorable.
PageOn.ai's AI Blocks feature has transformed how I structure persuasive arguments for different audiences. The tool allows you to create modular content components that can be easily rearranged to emphasize either data-driven projections for VCs or emotional impact stories for philanthropic donors.
Visual Elements That Drive Results
Through my experience designing presentations for both contexts, I've found that visual strategies play a crucial role in connecting with your audience. The right visual approach can make complex information immediately understandable and emotionally resonant.
Visual Strategy Comparison
This diagram illustrates the different visual approaches for each pitch type:
                    flowchart TD
                        subgraph VC["VC Pitch Visuals"]
                            VC1[Market Size Charts] --> VC2[Growth Trajectory Graphs]
                            VC2 --> VC3[Competitive Analysis Matrices]
                            VC3 --> VC4[Revenue Projection Dashboards]
                            VC4 --> VC5[Business Model Diagrams]
                        end
                        subgraph PH["Philanthropic Pitch Visuals"]
                            PH1[Human Impact Photography] --> PH2[Problem Visualization Maps]
                            PH2 --> PH3[Theory of Change Models]
                            PH3 --> PH4[Outcome Measurement Frameworks]
                            PH4 --> PH5[Beneficiary Journey Stories]
                        end
                        style VC fill:#FFF5E0,stroke:#FF8000
                        style PH fill:#F0F9FF,stroke:#0369A1
Data Visualization Approaches
VC Data Visualization
- Focus on growth metrics and financial projections
- Emphasis on market size and share visualization
- Clear comparison against competitors
- Milestone-based roadmaps with financial targets
- Unit economics breakdowns
Philanthropic Data Visualization
- Focus on impact metrics and lives changed
- Emphasis on problem scope and intervention results
- Before/after comparisons of beneficiary conditions
- Resource allocation transparency
- Sustainability indicators over time
Color Psychology in Presentations
The strategic use of color significantly impacts audience perception:
I've seen how color choices can subtly influence perception. VC pitches often leverage blues (trust, stability) and orange/gold (optimism, wealth), while philanthropic presentations frequently use greens (growth, renewal) and blues (compassion, trust).

When preparing your startup pitch deck, I recommend using PageOn.ai's Deep Search feature to source visuals that resonate with specific investor profiles. The tool can analyze investor preferences and suggest images that align with their portfolio aesthetics and decision-making patterns.
Crafting Your Financial Narrative
Financial storytelling is where I see the most dramatic differences between VC and philanthropic pitches. Each audience requires a distinct approach to discussing money, resources, and expected outcomes.
Financial Narrative Structure
How financial information flows in each pitch type:
                    flowchart TD
                        subgraph VC["VC Financial Narrative"]
                            VC1[Market Size & Opportunity] --> VC2[Revenue Model]
                            VC2 --> VC3[Current Traction]
                            VC3 --> VC4[Projections & Growth]
                            VC4 --> VC5[Funding Ask & Use of Funds]
                            VC5 --> VC6[Exit Strategy & ROI]
                        end
                        subgraph PH["Philanthropic Financial Narrative"]
                            PH1[Problem Cost to Society] --> PH2[Intervention Cost-Effectiveness]
                            PH2 --> PH3[Program Budget Breakdown]
                            PH3 --> PH4[Sustainability Plan]
                            PH4 --> PH5[Impact Per Dollar]
                            PH5 --> PH6[Long-term Resource Needs]
                        end
                        style VC fill:#FFF5E0,stroke:#FF8000
                        style PH fill:#F0F9FF,stroke:#0369A1
Financial Presentation Differences
| Financial Aspect | VC Approach | Philanthropic Approach |
|---|---|---|
| Financial Projections | 5-year revenue growth, margin expansion, market penetration | Cost per beneficiary, program efficiency ratios, impact milestones |
| Resource Allocation | Growth investments, R&D, marketing, team expansion | Program delivery, administrative overhead, monitoring & evaluation |
| Success Metrics | ARR, CAC:LTV ratio, burn rate, valuation growth | Lives impacted, behavior change, community indicators, SROI |
| Risk Presentation | Market risks, competitive threats, sensitivity analysis | Implementation challenges, external factors, beneficiary adoption |
| Timeline Focus | Quarterly milestones, annual targets, exit timeline | Program phases, long-term sustainability, systems change |
When planning your startup capital allocation, I recommend creating clear visual representations that show investors exactly how their money will accelerate growth. For philanthropic audiences, focus on demonstrating efficiency and direct impact of each dollar contributed.
PageOn.ai's AI Blocks feature has been invaluable for creating financial visualizations that tell compelling stories. The tool can automatically generate charts that highlight the most persuasive financial metrics for each audience type, whether that's ROI projections for VCs or impact-per-dollar metrics for philanthropic donors.
Case Studies: Success Stories in Both Worlds
I've analyzed dozens of successful pitches in both the venture capital and philanthropic spaces. These real-world examples provide valuable insights into what actually works when seeking funding.
VC Success: TechnoVision AI
This AI startup secured $12M in Series A funding with a pitch that masterfully combined technical innovation with clear market opportunity. Their presentation excelled at:
- Visual demonstration of proprietary technology advantage
- Compelling market size visualization showing TAM/SAM/SOM
- Clear unit economics with path to profitability
- Strategic use of early customer testimonials
"Their financial projections slide was a masterclass in clarity - showing both conservative and aggressive growth scenarios without overwhelming with numbers." — Lead Investor
Philanthropic Success: CleanWater Initiative
This nonprofit secured a $5M multi-year grant by effectively communicating both emotional impact and programmatic rigor. Their presentation succeeded by:
- Opening with powerful beneficiary storytelling
- Using geographic visualizations of intervention areas
- Presenting clear theory of change with measurable outcomes
- Demonstrating cost-effectiveness compared to alternatives
"Their presentation made us feel the urgency of the problem while giving us complete confidence in their methodical approach to solving it." — Foundation Director
Elements Present in Successful Pitches
Analysis of common elements in successful funding presentations:
I've found that successful pitches in both contexts share certain core elements, but with different emphasis. While VC pitches prioritize metrics and market analysis, philanthropic pitches lead with problem statements and stories. However, both require clear visuals and credible implementation plans.
PageOn.ai's Agentic capabilities have been game-changing for adapting successful elements from these case studies. The platform can analyze successful pitch patterns and suggest ways to incorporate similar techniques into your own presentations, while maintaining your unique value proposition.

Building Credibility Through Different Lenses
Establishing trust is fundamental to any successful pitch, but what constitutes credibility differs dramatically between venture capital and philanthropic contexts. I've identified key differences in how to build authority with each audience.
Credibility Framework
Key proof points that matter to different audiences:
                    flowchart TD
                        subgraph VC["VC Credibility Factors"]
                            VC1[Team Track Record] --> VC2[Technical Validation]
                            VC2 --> VC3[Early Traction Metrics]
                            VC3 --> VC4[Strategic Partnerships]
                            VC4 --> VC5[IP & Competitive Advantage]
                        end
                        subgraph PH["Philanthropic Credibility Factors"]
                            PH1[Mission Alignment] --> PH2[Community Relationships]
                            PH2 --> PH3[Impact Evidence]
                            PH3 --> PH4[Organizational Efficiency]
                            PH4 --> PH5[Transparency Practices]
                        end
                        style VC fill:#FFF5E0,stroke:#FF8000
                        style PH fill:#F0F9FF,stroke:#0369A1
Team Presentation Strategies
For VC Audiences:
When presenting to venture capitalists, I recommend highlighting team credentials that demonstrate execution capability and domain expertise:
- Previous exits and business successes
- Technical expertise and patents
- Industry connections and networks
- Educational pedigree (when relevant)
- Complementary skill sets among founders
For Philanthropic Audiences:
When presenting to philanthropic donors, I recommend highlighting team qualities that demonstrate commitment and authentic connection:
- Personal connection to the mission
- Experience working with beneficiary communities
- Subject matter expertise in the problem area
- Diverse perspectives and inclusive leadership
- History of successful program implementation
Risk Communication Strategies
How you address potential challenges and risks differs significantly between contexts. When creating a startup one pager for investors, be transparent about risks while showing mitigation strategies.
Risk Communication Emphasis
Different types of risks to address with each audience:
PageOn.ai's visual tools have been instrumental in creating representations of credentials and track records tailored to each audience. The platform allows you to highlight different aspects of your team's background and create visual risk matrices that address the specific concerns of your audience.
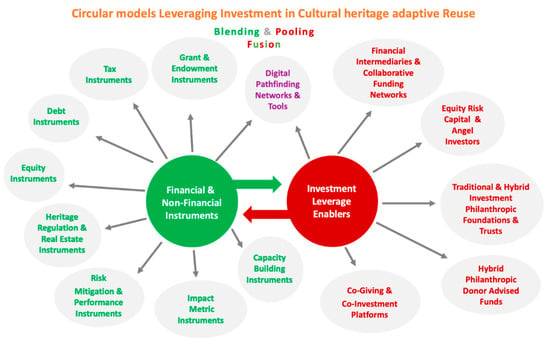
The Convergence: Impact Investing and Hybrid Models
I've been fascinated by the growing overlap between venture capital and philanthropy. Impact investing, social enterprises, and other hybrid models are creating new opportunities for organizations that can effectively communicate both financial and social returns.
The Funding Spectrum
Visualizing the continuum of funding approaches:
                    flowchart LR
                        VC["Traditional VC\n(Financial Returns)"] --> II["Impact Investing\n(Blended Returns)"] --> PH["Traditional Philanthropy\n(Social Returns)"]
                        subgraph HM["Hybrid Models"]
                            SE["Social\nEnterprise"]
                            VC_ESG["ESG-Focused\nVC"]
                            VP["Venture\nPhilanthropy"]
                            PRI["Program-Related\nInvestments"]
                        end
                        II --> HM
                        style VC fill:#FFE0B2,stroke:#FF8000
                        style II fill:#E0F2F1,stroke:#009688
                        style PH fill:#E3F2FD,stroke:#0369A1
                        style HM fill:#F3E5F5,stroke:#9C27B0
Balancing Dual Messaging
Creating effective pitches for impact investors requires a careful balance of financial and social impact messaging. Based on my experience, here are key strategies for hybrid pitch success:
Impact Investor Pitch Strategies
- Lead with the problem and solution, then demonstrate the market opportunity
- Show how impact metrics and financial performance are correlated
- Present clear theory of change alongside business model
- Highlight how scale drives both impact and financial returns
- Address potential tensions between impact and profit transparently
Impact Investing Growth
The growing market for investments that seek both financial and social returns:
PageOn.ai's flexible visual tools have proven invaluable for creating presentations that address multiple stakeholder priorities simultaneously. The platform allows you to seamlessly toggle between financial and impact-focused views of the same data, helping you craft narratives that resonate with hybrid funders.
Practical Implementation Guide
After years of crafting pitches for both contexts, I've developed a systematic approach for transforming presentations between venture capital and philanthropic audiences. Here's my step-by-step guide for adapting your pitch.
Pitch Transformation Process
A systematic approach to adapting your presentation:
                    flowchart TD
                        A[Identify Core Message] --> B[Analyze Audience Values]
                        B --> C[Adapt Key Metrics]
                        C --> D[Reframe Narrative]
                        D --> E[Adjust Visual Elements]
                        E --> F[Restructure Slides]
                        F --> G[Refine Call to Action]
                        subgraph VC2PH["VC to Philanthropic"]
                            VC1[Reframe ROI as Social Impact]
                            VC2[Add Beneficiary Stories]
                            VC3[Expand Problem Context]
                            VC4[Focus on Systemic Change]
                        end
                        subgraph PH2VC["Philanthropic to VC"]
                            PH1[Quantify Market Opportunity]
                            PH2[Add Business Model Details]
                            PH3[Emphasize Scalability]
                            PH4[Include Exit Scenarios]
                        end
                        D --> VC2PH
                        D --> PH2VC
Essential Components by Pitch Type
VC Pitch Essential Slides
- Problem & Opportunity: Market size, pain point intensity
- Solution: Unique value proposition, demo/product showcase
- Market Analysis: TAM/SAM/SOM, competitive landscape
- Business Model: Revenue streams, unit economics
- Traction: KPIs, growth metrics, customer testimonials
- Team: Expertise, track record, advisors
- Financial Projections: 3-5 year forecast, key assumptions
- Go-to-Market Strategy: Acquisition channels, growth plan
- Ask & Use of Funds: Amount, allocation, milestones
- Vision & Roadmap: Future products, exit scenarios
Philanthropic Pitch Essential Slides
- Problem Statement: Scope, urgency, human impact
- Mission & Vision: Purpose, values, long-term change
- Theory of Change: Intervention logic, evidence base
- Program Design: Approach, activities, beneficiaries
- Impact Metrics: Outcomes, measurement framework
- Team & Partners: Expertise, community connections
- Budget & Resources: Costs, efficiency ratios
- Implementation Timeline: Phases, milestones
- Sustainability Plan: Long-term funding, capacity
- Call to Action: Specific request, engagement options
Common Pitfalls to Avoid
VC Pitch Mistakes
- Overemphasis on social impact without clear business model
- Lack of market validation and competitive analysis
- Unrealistic financial projections without clear assumptions
- Insufficient focus on scalability and growth strategy
- Failing to demonstrate traction and early momentum
Philanthropic Pitch Mistakes
- Overemphasis on organizational needs rather than impact
- Lack of clear measurement framework for outcomes
- Insufficient evidence for intervention approach
- Too much focus on activities rather than results
- Failing to demonstrate community engagement and buy-in

PageOn.ai streamlines the process of creating both pitch types from a single foundational concept. The platform's templates and AI-powered content adaptation tools make it easy to transform your core message for different audiences without starting from scratch.
Pro Tip
Always test your presentation with representatives from your target audience before finalizing it. The feedback you receive can help you refine your messaging and address potential objections before the actual pitch.
Transform Your Visual Expressions with PageOn.ai
Whether you're pitching to venture capitalists or philanthropic donors, PageOn.ai gives you the tools to create compelling visual narratives that drive results. Our AI-powered platform helps you adapt your message for any audience while maintaining visual consistency and impact.
Start Creating with PageOn.ai TodayBringing It All Together
Throughout this guide, I've shared my insights on the fundamental differences between venture capital and philanthropic pitch strategies. From understanding audience psychology to crafting compelling financial narratives, the approaches diverge in significant ways.
However, I've also observed a growing convergence in these worlds through impact investing and hybrid models. This creates exciting opportunities for organizations that can effectively communicate both financial and social returns.
The key to success in either context is understanding your audience deeply and tailoring every aspect of your presentation to address their specific concerns, motivations, and decision criteria. With the right visual tools and strategic approach, you can craft pitches that resonate powerfully and drive the funding outcomes you seek.
PageOn.ai's visualization capabilities make this adaptation process seamless, allowing you to transform complex ideas into clear, compelling visual expressions that work for any audience. Whether you're seeking venture capital or philanthropic support, the right visual strategy can make all the difference in securing the funding you need to bring your vision to life.
You Might Also Like
10 Hidden Google Workspace Marketplace Gems for Transforming Your Presentations
Discover 10 powerful Google Workspace Marketplace add-ons that will revolutionize how you create, deliver, and collaborate on presentations. Unlock hidden gems for presenters.
Revolutionizing 3D Graphics Creation with AI: Transform Visual Design Workflows
Discover how AI is transforming 3D graphics creation across industries. Learn about text-to-3D, image-to-3D technologies, and practical workflows for designers and creators.
Transforming Presentation Creation Through Conversational AI | Building Presentations With Natural Language
Discover how natural language conversations are revolutionizing presentation creation, enabling faster, more intuitive visual storytelling with AI assistance that transforms abstract ideas into compelling visuals.
Mastering Dynamic Aspect Ratios in Modern Presentations | PageOn.ai
Discover how dynamic aspect ratio technology transforms presentation impact across devices and platforms. Learn implementation techniques, design principles, and future trends with PageOn.ai.