Trading Made Simple: How AI Transforms Candlestick Pattern Analysis
Empowering modern investors with intelligent visualization tools
I've spent years analyzing market patterns, and I'm excited to show you how artificial intelligence is revolutionizing the way we interpret candlestick patterns, making complex trading decisions more accessible than ever before.
The Evolution of Candlestick Pattern Analysis
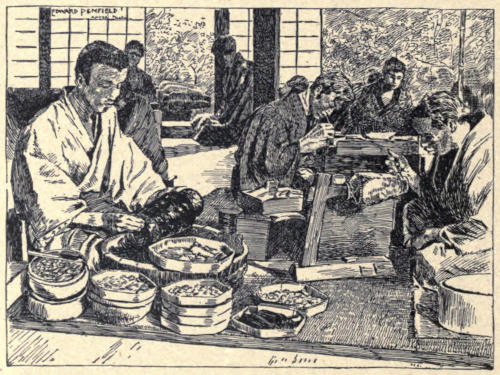
I've always been fascinated by how candlestick patterns originated in 18th century Japan, where rice trader Munehisa Homma developed this visual technique to track price movements in the Dojima Rice Exchange. What began as hand-drawn charts has evolved into sophisticated digital representations that we use today.
Traditional candlestick analysis relies heavily on visual pattern recognition skills that traders develop over years of practice. Each candlestick represents four price points - open, close, high, and low - creating distinctive shapes that signal potential market movements. However, I've found that the traditional approach comes with significant limitations:
- Pattern identification inconsistency between different traders
- Cognitive overload when analyzing multiple timeframes
- Subjective interpretation leading to confirmation bias
- Limited ability to process large volumes of historical data
In my experience, the cognitive burden of manually scanning charts for patterns can be overwhelming. This is where AI enters the picture, transforming how we approach candlestick analysis.
The Transition to AI-Augmented Analysis
                    flowchart LR
                        A[Traditional Analysis] -->|Evolution| B[Computer-Assisted]
                        B -->|Integration| C[AI-Augmented]
                        C -->|Automation| D[Predictive AI]
                        subgraph Human Effort
                        A
                        end
                        subgraph Mixed Approach
                        B
                        C
                        end
                        subgraph AI Dominance
                        D
                        end
                        style A fill:#FF8000,stroke:#333,stroke-width:1px
                        style B fill:#FFA040,stroke:#333,stroke-width:1px
                        style C fill:#FFC080,stroke:#333,stroke-width:1px
                        style D fill:#FFE0C0,stroke:#333,stroke-width:1px
I've witnessed firsthand how AI has revolutionized pattern identification speed and accuracy. What once took me hours of chart scanning can now be accomplished in seconds. The transition from expert-dependent analysis to AI-augmented trading decisions represents a democratization of technical analysis, making sophisticated pattern recognition accessible to traders of all experience levels.
Understanding Candlestick Patterns Through AI Visualization
In my trading journey, I've discovered that AI visualization tools excel at breaking down complex candlestick formations into visually digestible components. Traditional text descriptions often fail to capture the nuanced relationships between candles that AI can highlight through enhanced visualization techniques.

What I find particularly powerful is how AI visualization converts abstract market sentiment into clear visual indicators. For example, when I'm analyzing a potential reversal pattern, AI tools can highlight historical reliability metrics directly on the chart, showing me not just the pattern but its statistical significance based on past occurrences.
Using PageOn.ai's AI Blocks feature, I've been able to construct custom pattern recognition dashboards that focus on the specific patterns most relevant to my trading strategy. This modular approach allows me to visualize only what matters to my decision-making process, reducing noise and information overload.
Pattern Reliability Across Market Conditions
One of the most valuable aspects I've found is the ability to visualize pattern reliability metrics across different market conditions. As shown in the chart above, patterns like the Morning Star perform exceptionally well in bull markets (88% reliability) but are less reliable in sideways markets (55%). This kind of visualization helps me adapt my strategy to current market conditions rather than applying patterns universally.
Key Candlestick Patterns Demystified with AI
Reversal Patterns
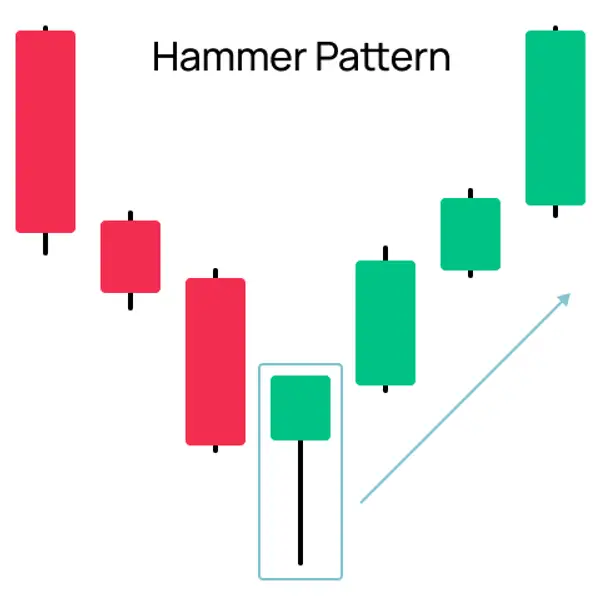
In my trading practice, I've found that hammers and hanging men are among the most powerful reversal signals when correctly identified. AI-enhanced visual identification has transformed my approach by highlighting subtle criteria that traditional analysis might miss:
- Shadow length ratio to body (AI can calculate optimal ratios based on historical success)
- Volume confirmation overlaid directly on the pattern
- Context visualization showing nearby support/resistance levels
Engulfing patterns have always been favorites in my trading arsenal. With AI visualization, I can now detect strength indicators within these patterns, such as the percentage of engulfment and the momentum behind the engulfing candle. This gives me much greater confidence in distinguishing between high-probability and low-probability setups.
Morning Star Formation Breakdown
                    flowchart TD
                        A[Long Bearish Candle] --> B[Small Body Candle]
                        B --> C[Long Bullish Candle]
                        subgraph "Day 1: Market Sentiment"
                        A --- A1[Strong Selling Pressure]
                        end
                        subgraph "Day 2: Market Indecision"
                        B --- B1[Price Stabilization]
                        end
                        subgraph "Day 3: Reversal Confirmation"
                        C --- C1[Strong Buying Pressure]
                        C --- C2[Closes above Day 1 midpoint]
                        end
                        style A fill:#F44336,stroke:#333,stroke-width:1px
                        style B fill:#9E9E9E,stroke:#333,stroke-width:1px
                        style C fill:#4CAF50,stroke:#333,stroke-width:1px
Morning and evening stars are complex three-candle formations that I've found particularly challenging to identify consistently. AI visualization breaks down these patterns into their component parts, as shown above, making it much easier to understand the market psychology at play during each phase of the pattern formation.
Continuation Patterns
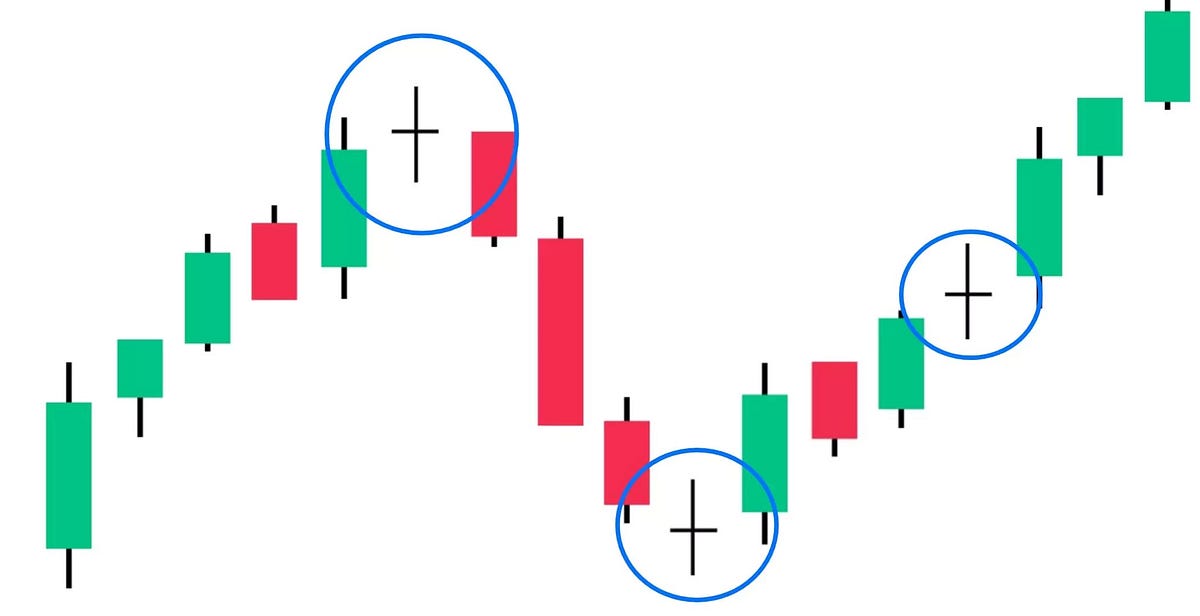
The psychology behind doji formations has always fascinated me. These candles, representing market indecision, become much more meaningful when AI visualization highlights contextual factors such as:
Volume Characteristics
AI visualization can overlay volume patterns directly onto doji candles, showing whether the indecision comes with high or low volume - a critical distinction for predicting subsequent moves.
Trend Context
I've learned that doji formations have different implications depending on where they appear in an existing trend. AI visualization can highlight whether a doji represents a potential reversal or merely a pause in the current trend.
For harami patterns, I've found AI-powered probability assessment based on historical performance to be incredibly valuable. Rather than treating all harami patterns equally, AI visualization allows me to see which specific variations have the highest probability of success based on factors like:
- Size ratio between the two candles
- Position within larger price structures
- Correlation with other technical indicators
Using PageOn.ai's Deep Search functionality has transformed my pattern analysis. I can now find similar historical pattern occurrences and their outcomes across multiple timeframes and instruments. This gives me a much more robust statistical foundation for my trading decisions than relying solely on textbook pattern definitions or my limited personal experience.
From Pattern Recognition to Trading Strategy
Throughout my trading career, I've learned that recognizing patterns is only the first step. The real challenge lies in translating visual pattern insights into actionable trading rules. With AI visualization tools, I can now develop rule-based systems that trigger based on pattern recognition combined with confirmation criteria.

Creating personalized trading dashboards that highlight my preferred patterns has been a game-changer for my decision-making process. I can now focus on the patterns that align with my risk tolerance and trading style, filtering out noise and reducing the cognitive load of market analysis.
Combined Technical Analysis Approach
                    flowchart TD
                        A[Candlestick Pattern Identified] --> B{Pattern Confirmed?}
                        B -->|Yes| C[Check Volume Confirmation]
                        B -->|No| A
                        C --> D{Volume Confirms?}
                        D -->|Yes| E[Check Trend Indicators]
                        D -->|No| A
                        E --> F{Trend Aligns?}
                        F -->|Yes| G[Check Support/Resistance]
                        F -->|No| A
                        G --> H{Near Key Level?}
                        H -->|Yes| I[High Probability Setup]
                        H -->|No| J[Moderate Probability Setup]
                        style I fill:#4CAF50,stroke:#333,stroke-width:1px
                        style J fill:#FFC107,stroke:#333,stroke-width:1px
I've found tremendous value in combining candlestick analysis with other technical indicators through AI visualization. For example, overlaying relative strength index (RSI) divergence directly onto candlestick patterns provides a powerful confirmation mechanism that I use to filter out lower-probability setups.
PageOn.ai's Vibe Creation feature has enabled me to refine my strategies through conversation-based interaction. Instead of manually adjusting parameters, I can simply describe the patterns I'm looking for and how I want to filter them, and the AI helps me visualize these criteria instantly.
One of the most important aspects of my strategy development has been creating visual backtesting frameworks to validate pattern-based strategies. By visualizing how specific patterns have performed historically across different market conditions, I can develop more robust trading rules with clearly defined risk parameters.
Real-World Applications and Case Studies
In my analysis of recent market corrections, I've found that AI-powered candlestick pattern recognition provides remarkable insights. By examining visual pattern recognition across Wall Street's financial crises, we can identify recurring candlestick formations that often precede significant market movements.
What I find particularly exciting is how retail traders are now using AI pattern recognition to compete with institutional investors. The playing field is becoming more level as sophisticated pattern recognition tools that were once available only to large financial institutions are now accessible to individual traders through platforms like PageOn.ai.
Case Study: Cryptocurrency Market Patterns
In my recent analysis of Bitcoin's price action during the 2021 bull run, I identified several key patterns that provided profitable entry and exit points:
What I discovered was that traditional candlestick patterns behave differently in cryptocurrency markets compared to conventional financial markets. The volatility creates more pronounced pattern formations, but also requires stricter confirmation criteria to filter out false signals. AI visualization tools helped me identify these nuances and adapt my strategy accordingly.
In my trading practice, I've found that integrating AI stock charting tools with candlestick pattern analysis creates a powerful decision-making framework. The combination allows me to identify patterns more accurately and place them in the broader context of market trends and conditions.
Building Your AI-Powered Trading Dashboard
From my experience, creating an effective candlestick pattern analysis dashboard requires careful consideration of several essential components:
Pattern Scanner
A dedicated area that continuously scans multiple timeframes for your selected patterns, prioritizing by probability score.
Historical Performance Metrics
Visual representation of how each pattern has performed historically in similar market conditions.
Confirmation Indicators
Supplementary technical indicators that provide confirmation signals for identified patterns.
Risk Management Calculator
Automated calculation of optimal position sizing and stop-loss placement based on pattern statistics.

I've found that customizing visual alerts for my most reliable patterns significantly improves my trading efficiency. By setting up personalized notification parameters based on pattern formation combined with volume and momentum confirmation, I can focus on other tasks while my dashboard monitors the markets for high-probability setups.
Integrating AI-powered growth charts to track pattern performance over time has been invaluable for my trading development. These visualizations allow me to see which patterns are performing best in current market conditions and adjust my strategy accordingly.
Pattern Performance Tracking
I've been using PageOn.ai to create personalized trading journals with visual pattern documentation, which has dramatically improved my learning curve. By documenting both successful and unsuccessful trades alongside the patterns that triggered them, I can identify subtle nuances in pattern formation that might be missed in textbook definitions.
Another valuable addition to my dashboard has been AI-powered bar chart generators that complement candlestick analysis. These tools help me visualize volume patterns and market breadth indicators that provide important context for candlestick pattern interpretation.
The Future of AI-Enhanced Technical Analysis
As I look toward the future of trading, I'm excited about emerging AI capabilities in predictive pattern recognition. Machine learning algorithms are now being trained on decades of market data to identify not just known patterns, but also novel formations that might not be documented in traditional technical analysis literature.

I've been following how generative AI market reports are transforming trading intelligence. These tools go beyond simple pattern recognition to generate comprehensive market narratives that place technical patterns in the broader context of fundamental factors and sentiment indicators.
Integration of Technical and Sentiment Analysis
                    flowchart LR
                        A[Candlestick Patterns] --> D[AI Integration Layer]
                        B[Technical Indicators] --> D
                        C[Market Sentiment Data] --> D
                        E[News & Social Media] --> C
                        F[Institutional Positioning] --> C
                        G[Retail Trader Sentiment] --> C
                        D --> H[Comprehensive Market View]
                        H --> I[Trading Decisions]
                        style D fill:#FF8000,stroke:#333,stroke-width:1px
                        style H fill:#FF8000,stroke:#333,stroke-width:1px
The integration of sentiment analysis with visual pattern recognition represents one of the most promising frontiers in trading technology. By correlating social media sentiment, news headlines, and other alternative data sources with traditional candlestick patterns, AI can provide a much more nuanced view of potential market movements.
As I incorporate these advanced tools into my trading practice, I remain mindful of the ethical considerations in AI-powered trading decisions. The risk of over-reliance on algorithms without understanding their limitations is real, as is the potential for AI systems to create feedback loops in the market when many traders use similar tools.
Preparing for the Future
Based on my experience with emerging AI trading technologies, here are the key areas I'm focusing on to stay ahead of the curve:
- Hybrid Intelligence: Combining my human intuition and experience with AI pattern recognition capabilities
- Continuous Learning: Regularly updating my understanding of how AI interprets patterns as algorithms evolve
- Custom Visualization: Developing personalized visual interfaces that match my trading style and cognitive preferences
- Cross-Market Analysis: Using AI to identify pattern correlations across different asset classes and timeframes
- Risk Management Automation: Implementing AI-powered position sizing and risk control mechanisms
I believe we're entering an era where visual AI will transform retail trading capabilities, democratizing sophisticated analysis tools that were once available only to institutional investors. For traders willing to embrace these new technologies while maintaining a thoughtful approach to their implementation, the future looks incredibly promising.
Transform Your Trading Visualization with PageOn.ai
Ready to elevate your candlestick pattern analysis with AI-powered visualization tools? Start creating custom trading dashboards that highlight the patterns most relevant to your strategy.
Start Creating with PageOn.ai TodayEmbracing the AI Visualization Revolution
Throughout my trading journey, I've witnessed firsthand how AI-powered visualization tools have transformed candlestick pattern analysis from an art form requiring years of experience into a more accessible, data-driven approach that benefits traders of all levels.
The combination of traditional candlestick wisdom with modern AI visualization creates a powerful synergy that enhances pattern recognition accuracy, trading decision confidence, and ultimately, trading performance. By leveraging tools like PageOn.ai, traders can create personalized visual frameworks that align with their unique strategies and cognitive preferences.
As we move forward, I believe the most successful traders will be those who embrace these AI visualization capabilities while maintaining their human judgment and intuition. The future of trading isn't about replacing human decision-making with algorithms, but rather augmenting our natural pattern recognition abilities with powerful AI-driven visual tools that help us see more clearly in an increasingly complex market landscape.
You Might Also Like
Mastering Visual Harmony: The Art and Science of Cohesive Slide Layouts
Discover how to create visually harmonious slide layouts through color theory, typography, and spatial design. Learn professional techniques to elevate your presentations with PageOn.ai.
The Art of Data Storytelling: Creating Infographics That Captivate and Inform
Discover how to transform complex data into visually compelling narratives through effective infographic design. Learn essential techniques for enhancing data storytelling with visual appeal.
Transforming Presentations: Strategic Use of Color and Imagery for Maximum Visual Impact
Discover how to leverage colors and images in your slides to create visually stunning presentations that engage audiences and enhance information retention.
The Strategic GIF Guide: Creating Memorable Moments in Professional Presentations
Discover how to effectively use GIFs in professional presentations to create visual impact, enhance audience engagement, and communicate complex concepts more memorably.