Transform Text into Professional Diagrams with AI
The Future of Visual Communication
In today's fast-paced world, visual communication has become essential for conveying complex ideas efficiently. I've witnessed firsthand how traditional diagramming tools often create bottlenecks in the creative process. The good news? We're now entering a new era where AI is revolutionizing how we transform text into professional diagrams, making visual communication more accessible and efficient than ever before.
Throughout this guide, I'll explore how text to graphic AI tools are changing the landscape of visual communication, the technology behind these innovations, and how you can leverage them to enhance your workflow across various industries.
The Evolution of Diagram Creation
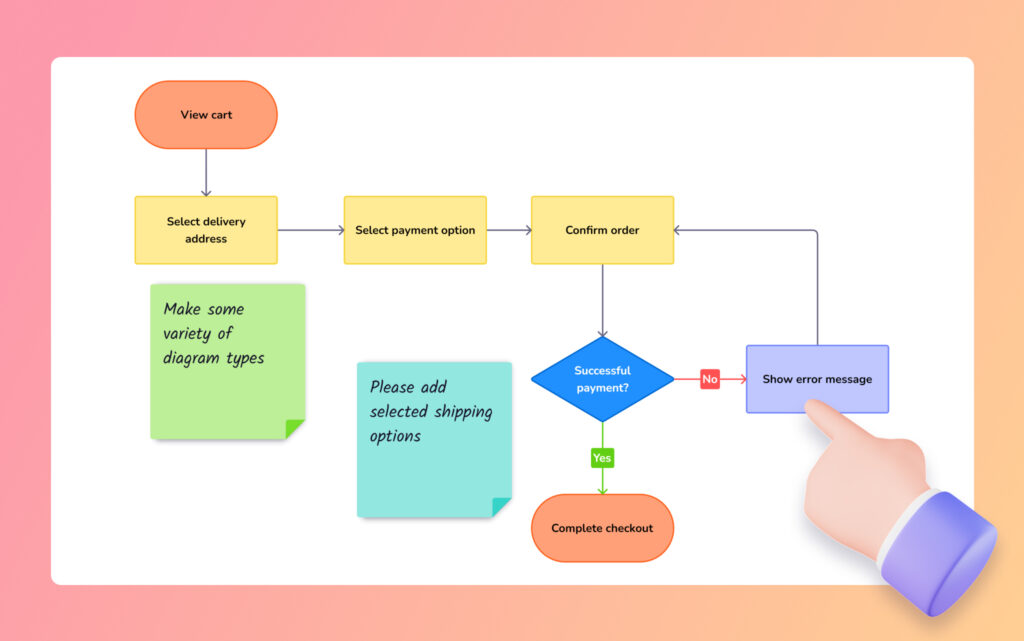
I remember when creating diagrams meant spending hours wrestling with complex software, dragging shapes around and manually connecting elements. The traditional approach to diagram creation has long been plagued by several key challenges:
- Time-consuming processes that took focus away from actual problem-solving
- Steep learning curves for specialized diagramming tools
- Requirements for design skills that many professionals simply don't have
- Difficulty maintaining consistency across team-created diagrams
The Evolution of Diagram Creation Methods
The shift from manual to AI-powered diagram creation represents a fundamental transformation in how we approach visual communication. With the emergence of AI chart generators from text, we're witnessing a democratization of diagram creation.
Today's market offers various text-to-diagram AI tools, each with unique capabilities and specializations. What they all share is the promise to reduce the friction between having an idea and visualizing it professionally. This evolution isn't just about convenience—it's fundamentally changing who can create diagrams and how quickly ideas can be visually expressed.
Understanding AI-Powered Diagram Generation
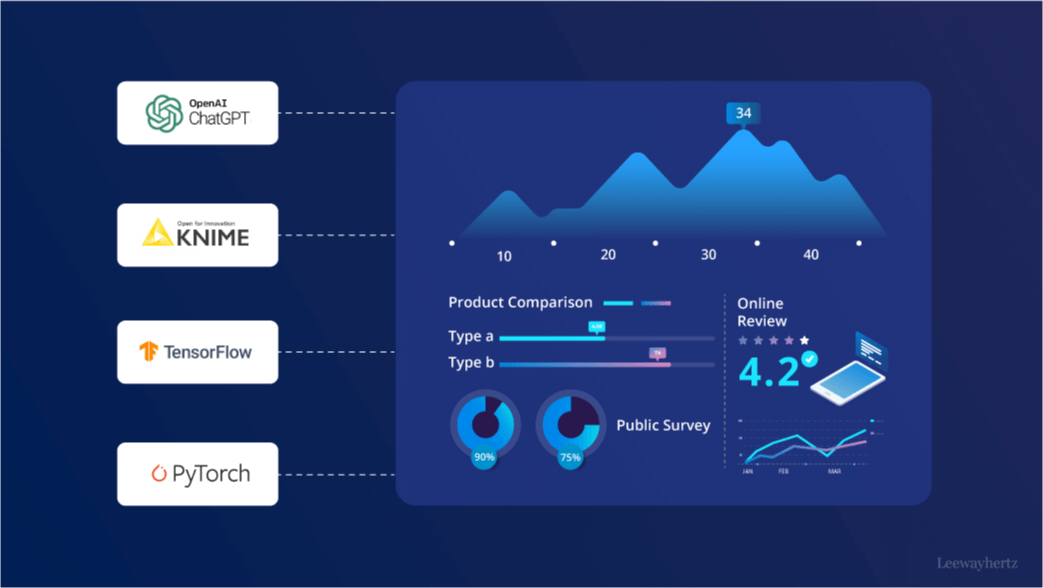
At the heart of text-to-diagram technology lies a sophisticated combination of Natural Language Processing (NLP) and specialized machine learning models. I find it fascinating how these systems can interpret human language and transform it into structured visual elements.
Text-to-Diagram AI Processing Flow
flowchart TD
    A[Text Input] --> B[NLP Processing]
    B --> C{Element Recognition}
    C --> D[Identify Entities]
    C --> E[Detect Relationships]
    C --> F[Determine Hierarchy]
    D --> G[Visual Element Mapping]
    E --> G
    F --> G
    G --> H[Layout Optimization]
    H --> I[Diagram Rendering]
    I --> J[User Feedback Loop]
    J --> |Refinement| B
When you provide a text description to an AI diagramming tool, here's what typically happens behind the scenes:
- Text Analysis: NLP algorithms parse your description, identifying key entities, actions, and relationships
- Pattern Recognition: The system recognizes common diagram patterns based on your description
- Element Mapping: Text concepts are mapped to appropriate visual elements (boxes, arrows, etc.)
- Layout Generation: AI determines optimal positioning and connections between elements
- Visual Rendering: The final diagram is rendered according to style guidelines
Modern AI can generate an impressive variety of diagram types from textual descriptions. Each type requires specialized understanding of conventions and relationships:
Flowcharts & Process Maps
Sequential steps with decision points and process flows
System Architecture Diagrams
Components, connections, and system boundaries
Entity-Relationship Diagrams
Data structures and their relationships
Sequence Diagrams
Time-ordered interactions between components
Mind Maps
Hierarchical representation of ideas and concepts
Concept Maps
Networks of interrelated concepts and propositions

What makes these AI systems particularly powerful is their ability to learn from examples. By training on thousands of professionally created diagrams, they can recognize patterns and best practices that might take humans years to master. This enables even those with minimal design experience to produce diagrams that follow industry standards and visual communication best practices.
PageOn.ai's Approach to Text-to-Diagram Transformation
In my experience working with various diagramming tools, I've found that PageOn.ai takes a uniquely powerful approach to text-to-diagram transformation. At its core, PageOn.ai excels at converting abstract textual concepts into structured visual elements through several innovative technologies.
PageOn.ai's Text-to-Diagram Framework
flowchart LR
    subgraph Input
        A[Text Description]
    end
    subgraph "PageOn.ai Processing"
        B[Conversation Engine]
        C[AI Blocks System]
        D[Deep Search Technology]
        E[Visual Assembly Engine]
    end
    subgraph Output
        F[Interactive Diagram]
    end
    A --> B
    B --> C
    C --> D
    D --> E
    E --> F
    F -.-> |Feedback Loop| B
One of the standout features I appreciate about PageOn.ai is its AI Blocks system. These function as intelligent diagram building components that understand both visual design principles and the semantic meaning of what they represent. Unlike traditional diagramming elements, AI Blocks can:
- Adaptively resize and position themselves based on content and context
- Maintain semantic relationships with connected elements
- Suggest appropriate visual representations for abstract concepts
- Evolve as your diagram requirements change

What truly sets PageOn.ai apart is its conversation-driven approach to diagram creation. Rather than simply generating a static diagram from text, the system engages in an iterative dialogue that helps refine and enhance your visual representation. This conversational UI allows me to:
- Clarify ambiguous elements in my initial description
- Explore alternative visual representations for complex concepts
- Progressively add detail to specific sections of the diagram
- Get suggestions for improving visual clarity and impact
The Deep Search technology integrated into PageOn.ai ensures that diagram elements are semantically rich and contextually appropriate. When creating technical diagrams, this means the system can suggest industry-standard symbols and conventions without requiring me to specify them explicitly. For collaborative teams, PageOn.ai's real-time editing capabilities mean multiple team members can contribute to and refine diagrams simultaneously, with AI assistance guiding the process toward clarity and consistency.
Practical Applications Across Industries
I've seen AI-powered diagramming tools transform workflows across numerous industries. Their versatility and efficiency make them valuable in virtually any context where visual communication is needed.
Business and Project Management

In business contexts, I've found that AI conversion of text to presentations and diagrams dramatically accelerates decision-making and alignment. Text-to-diagram AI excels at:
- Workflow Visualization: Quickly transforming process descriptions into clear flowcharts
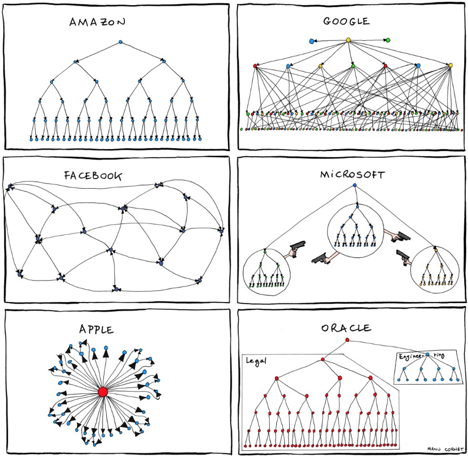
- Organizational Mapping: Generating org charts and team structures from textual descriptions
- Customer Journey Mapping: Visualizing the customer experience across touchpoints
- Strategic Planning: Creating roadmaps and strategy visualizations from planning documents
Software Development and IT
Example: System Architecture from Text Description
flowchart TD
    subgraph Client
        A[Web Frontend]
        B[Mobile App]
    end
    subgraph "API Gateway"
        C[Authentication]
        D[Request Routing]
        E[Rate Limiting]
    end
    subgraph "Microservices"
        F[User Service]
        G[Content Service]
        H[Analytics Service]
    end
    subgraph "Data Layer"
        I[(User DB)]
        J[(Content DB)]
        K[(Analytics DB)]
    end
    A --> C
    B --> C
    C --> D
    D --> E
    E --> F
    E --> G
    E --> H
    F --> I
    G --> J
    H --> K
For development teams, I've observed how text-to-diagram tools significantly reduce documentation overhead while improving clarity:
- System Architecture: Translating architectural descriptions into clear component diagrams
- Database Schemas: Generating ERD diagrams from database structure descriptions
- API Interactions: Visualizing endpoint relationships and data flows
- User Flows: Creating intuitive user journey maps from feature requirements
Education and Training
Educational Diagram Usage by Subject Area
In educational settings, I've seen how text-to-diagram tools help both educators and students:
- Concept Visualization: Making abstract concepts concrete through visual representation
- Process Illustration: Breaking down complex processes into step-by-step visual guides
- Knowledge Mapping: Creating relationship diagrams that connect ideas across domains
- Learning Materials: Quickly generating clear diagrams for handouts and presentations
The Advantages of AI-Powered Diagramming
After using various diagramming approaches throughout my career, I can confidently say that AI-powered solutions offer substantial advantages that transform how we approach visual communication.
Time Savings with AI-Powered Diagramming
Time Efficiency
What once took me hours of meticulous work can now be accomplished in seconds. The dramatic reduction in diagram creation time means I can focus on refining ideas rather than wrestling with tools.
Accessibility
I've seen how AI-powered diagramming democratizes visual communication, allowing team members without design skills to create professional-quality diagrams that clearly communicate their ideas.
Consistency
Maintaining visual standards across an organization has always been challenging. AI diagramming tools ensure consistent styling, terminology, and layout principles across all diagrams.
Iteration Speed
The conversational feedback loop of modern AI diagramming tools allows me to rapidly refine visualizations, testing multiple approaches in the time it would take to create a single diagram manually.
Perhaps the most significant advantage I've found is the integration capabilities with existing documentation and presentation tools. Modern AI diagramming solutions like PageOn.ai don't exist in isolation—they seamlessly connect with the tools teams already use, allowing diagrams to be easily embedded in presentations, documents, wikis, and other collaborative platforms. This integration eliminates the friction of switching between tools and ensures diagrams remain up-to-date across all touchpoints.
Best Practices for Text-to-Diagram Conversion
Through my experience with text-to-diagram tools, I've developed several best practices that consistently produce better results. The quality of your output depends significantly on how you structure your input text.
Effective Text-to-Diagram Prompt Structure
flowchart TD
    A[Start with Diagram Type] --> B[Define Main Components]
    B --> C[Specify Relationships]
    C --> D[Add Hierarchy/Structure]
    D --> E[Include Visual Preferences]
    E --> F[Request Specific Conventions]
    style A fill:#FFE0B2,stroke:#FF8000
    style B fill:#FFE0B2,stroke:#FF8000
    style C fill:#FFE0B2,stroke:#FF8000
    style D fill:#FFE0B2,stroke:#FF8000
    style E fill:#FFE0B2,stroke:#FF8000
    style F fill:#FFE0B2,stroke:#FF8000
Writing Effective Text Prompts
When crafting text prompts for diagram generation, I follow these principles:
- Be explicit about diagram type: Clearly state whether you want a flowchart, mind map, ERD, etc.
- Use structured descriptions: Organize your text logically, similar to how you want the diagram structured
- Define relationships clearly: Use consistent terminology for connections (e.g., "connects to," "depends on")
- Specify hierarchy: Indicate parent-child relationships or levels of importance
- Include visual preferences: Mention color schemes, layout direction, or style preferences
Example: Poor vs. Effective Prompt
❌ Poor Prompt:
"Make a diagram about our user authentication process."
✅ Effective Prompt:
"Create a sequence diagram for our user authentication process. It should show interactions between: 1) User, 2) Frontend, 3) Auth Service, and 4) Database. The process starts with the user entering credentials, the frontend validating format, then sending to the auth service which checks against the database. If valid, return a JWT token, if invalid, return an error message. Use standard UML sequence diagram conventions with blue for user actions and orange for system processes."
Balancing Detail and Clarity
Finding the right balance between providing sufficient detail and maintaining clarity is crucial:
- Start with a high-level overview before diving into specifics
- Prioritize the most important relationships and components
- Use consistent terminology throughout your description
- Break complex systems into logical groupings or subsystems
- Consider creating multiple focused diagrams rather than one overly complex visualization
Refining AI-Generated Diagrams
I've found that getting the perfect diagram often requires iteration. Here are my techniques for refining AI-generated diagrams:
- Use conversational feedback to guide refinements (e.g., "Make the user flow more prominent")
- Request specific adjustments to layout, grouping, or emphasis
- Ask for alternative visualizations of the same information
- Progressively add detail after establishing the basic structure
- Verify technical accuracy while leveraging AI for visual optimization
With tools like AI image generators from text, the key is finding the right balance between human guidance and AI assistance. I maintain responsibility for the diagram's accuracy while leveraging the AI's capabilities for layout optimization, styling consistency, and visual clarity.
Future Trends in AI-Powered Diagram Creation
As someone who closely follows developments in this field, I'm excited about several emerging trends that will shape the future of AI-powered diagram creation.
Adoption Timeline of Advanced Diagramming Features
Integration with Other AI Technologies
I expect to see deeper integration between text-to-diagram tools and other AI visualization technologies. Imagine describing a complex system and getting not just a static diagram, but also an accompanying 3D visualization or an interactive simulation that brings your concept to life.
Interactive and Dynamic Diagrams
The future of diagramming is dynamic, not static. Soon, AI-generated diagrams will be fully interactive, allowing users to expand sections, drill down into details, simulate processes, and modify parameters to see how systems respond in real-time.
Collaborative Diagramming with AI
AI will become an active participant in collaborative diagramming sessions, suggesting improvements, resolving conflicts between different team members' inputs, and ensuring that the final diagram accurately represents the collective understanding.
Industry-Specific Solutions
We'll see more specialized AI diagramming tools that understand industry-specific terminology, standards, and conventions. These tools will automatically apply the right symbols, layouts, and structures for fields like healthcare, finance, manufacturing, and more.
Evolution of AI Diagramming Intelligence
flowchart LR
    A[Basic Text Parsing] --> B[Pattern Recognition]
    B --> C[Context Understanding]
    C --> D[Design Principles]
    D --> E[Interactive Suggestions]
    E --> F[Autonomous Refinement]
    F --> G[Predictive Diagramming]
    style A fill:#FFEBEE,stroke:#E74C3C
    style B fill:#FFEBEE,stroke:#E74C3C
    style C fill:#FFF9C4,stroke:#FFC107
    style D fill:#FFF9C4,stroke:#FFC107
    style E fill:#E8F5E9,stroke:#2ECC71
    style F fill:#E8F5E9,stroke:#2ECC71
    style G fill:#E8F5E9,stroke:#2ECC71
Perhaps the most exciting development I anticipate is the evolution toward more intelligent diagram suggestion systems. Future AI won't just passively create what you ask for—it will proactively suggest better ways to visualize your information based on:
- The specific audience who will view the diagram
- The context in which the diagram will be used (presentation, documentation, analysis)
- Best practices for visual communication in your specific domain
- Cognitive science principles about information processing and retention
- Your personal or organizational diagramming preferences and history
As these technologies mature, the boundary between describing what you want and getting what you need will continue to blur. AI-powered diagramming will increasingly feel like working with a skilled visual communication expert who understands both your content and your goals.
Getting Started with PageOn.ai for Diagram Creation
Based on my experience, getting started with PageOn.ai for diagram creation is straightforward and rewarding. Here's my step-by-step guide to help you begin transforming your text into professional diagrams.
PageOn.ai Diagram Creation Workflow
flowchart LR
    A[Create Account] --> B[Start New Project]
    B --> C[Enter Text Description]
    C --> D[Select Diagram Type]
    D --> E[Generate Initial Diagram]
    E --> F{Review & Refine}
    F --> |Needs Changes| G[Provide Feedback]
    G --> E
    F --> |Approved| H[Export & Share]
    style A fill:#E3F2FD,stroke:#2196F3
    style B fill:#E3F2FD,stroke:#2196F3
    style C fill:#E3F2FD,stroke:#2196F3
    style D fill:#E3F2FD,stroke:#2196F3
    style E fill:#FFF3E0,stroke:#FF9800
    style F fill:#FFF3E0,stroke:#FF9800
    style G fill:#FFF3E0,stroke:#FF9800
    style H fill:#E8F5E9,stroke:#4CAF50
Setting Up Your First Text-to-Diagram Project
To begin using PageOn.ai for diagram creation:
- Create a PageOn.ai account and select "New Diagram" from your dashboard
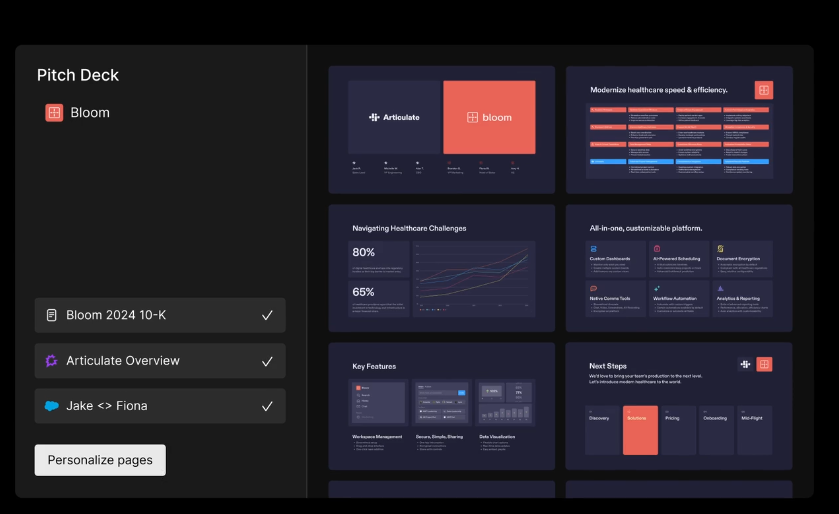
- Choose between starting from scratch or using a template relevant to your needs
- Enter a descriptive name and optional tags to organize your diagram project
- Set up sharing permissions if you'll be collaborating with team members
- Determine your output goals (presentation, documentation, etc.) to guide the AI
Converting Existing Documentation into Visual Diagrams
One of my favorite features is the ability to transform existing text documentation into diagrams:
- Import text directly from documents, wikis, or specification files
- Use the "Extract Diagram" feature to identify diagrammable content within longer documents
- Select the most appropriate diagram type for your content
- Refine the generated diagram using the conversational interface
- Link the diagram back to your source documentation for traceability
Customizing Diagram Styles and Visual Elements
PageOn.ai offers extensive customization options to ensure your diagrams match your brand and preferences:
- Apply predefined style themes or create custom themes
- Adjust color schemes, fonts, and connector styles
- Import custom icons or use the extensive built-in library
- Save your customizations as reusable templates
- Apply consistent styling across multiple diagrams with one click
Sharing and Collaborating on Diagrams
Collaboration is seamless with PageOn.ai:
- Invite team members to view or edit diagrams
- Assign specific sections of complex diagrams to different team members
- Use the commenting system for feedback and discussion
- Track changes and version history
- Export diagrams in multiple formats (PNG, SVG, PDF, interactive HTML)
Integration with Broader Workflows
PageOn.ai integrates smoothly with your existing tools and processes:
- Embed interactive diagrams in presentations and documents
- Integrate with project management tools like Jira, Asana, and Trello
- Connect with documentation systems like Confluence and Notion
- Set up automation for diagram updates when source information changes
- Use the API to incorporate diagram generation into your custom workflows
By leveraging image to text AI capabilities alongside text-to-diagram features, PageOn.ai offers a comprehensive solution for all your visual communication needs. You can even extract information from existing diagrams and reimagine them with enhanced clarity and design.
Transform Your Visual Expressions with PageOn.ai
Ready to convert your complex ideas into clear, professional diagrams in seconds? PageOn.ai's AI-powered diagramming tools make it possible for anyone to create stunning visualizations without design skills or technical expertise.
Start Creating with PageOn.ai TodayEmbracing the Future of Visual Communication
Throughout this guide, I've explored how AI is transforming the way we create diagrams, making professional-quality visualizations accessible to everyone. The evolution from manual diagramming to AI-powered solutions represents a fundamental shift in how we communicate complex ideas.
As we look to the future, the integration of advanced AI capabilities with diagramming tools will continue to reduce barriers to effective visual communication. Whether you're a business professional explaining a new strategy, a developer documenting system architecture, or an educator making complex concepts accessible, AI-powered diagramming tools like PageOn.ai offer unprecedented efficiency and accessibility.
I encourage you to explore how these tools can transform your own workflow. Start small, perhaps by converting an existing text document into a visual diagram, and experience firsthand the clarity and impact that professional diagrams can bring to your communication. As AI continues to advance, the gap between your ideas and their visual expression will continue to narrow, empowering more effective communication across all domains.
You Might Also Like
AI-Powered Coding Assistants: Integrating Language Models into Development Workflows
Discover how AI coding assistants transform development workflows by integrating language models to create visual clarity in complex programming environments.
Transforming Legal Reasoning: Visual Approaches to Modern Jurisprudence | PageOn.ai
Discover how visual approaches are revolutionizing legal reasoning in modern jurisprudence. Learn practical tools, methodologies, and technological innovations for enhanced legal analysis.
Creating Interactive and Animated Infographics for Enhanced User Engagement
Discover how to transform data into captivating interactive stories through animated infographics. Learn best practices, technical approaches, and tools for creating engaging visual experiences.
Platform-Specific Infographic Formatting: Optimize for Social Media Success
Master platform-specific infographic formatting for Instagram, Pinterest, LinkedIn, Twitter & Facebook. Learn optimal dimensions, aspect ratios & design strategies for social media success.