Transforming Customer Frustrations into Compelling Visual Sales Narratives
Discover how to identify, analyze, and visually address customer pain points to create persuasive sales solutions.
Understanding the Anatomy of Customer Pain Points
I've found that understanding customer pain points is the foundation of effective sales solutions. When we can accurately identify what's troubling our customers, we're better positioned to offer targeted solutions that resonate on both rational and emotional levels.
The Four Categories of Pain Points
In my experience working with sales teams, I've observed that customer pain points typically fall into four distinct categories:
flowchart TD
    A[Customer Pain Points] --> B[Financial]
    A --> C[Process/Efficiency]
    A --> D[Support]
    A --> E[Product]
    B --> B1[Budget constraints]
    B --> B2[ROI concerns]
    B --> B3[Cost justifications]
    C --> C1[Time-consuming workflows]
    C --> C2[Productivity barriers]
    D --> D1[Inadequate guidance]
    D --> D2[Confusing information]
    E --> E1[Feature gaps]
    E --> E2[Usability issues]
    E --> E3[Integration challenges]
    classDef orange fill:#FF8000,stroke:#333,stroke-width:1px,color:white;
    class A orange
1. Financial Pain Points
Financial pain points are often the most immediate and pressing for customers as they directly impact their bottom line. These include budget constraints, concerns about return on investment, and the need to justify costs to stakeholders. When I work with clients facing financial pain points, I focus on demonstrating clear value and quantifiable returns to help them overcome these obstacles.
2. Process/Efficiency Pain Points
These pain points revolve around workflows that consume excessive time or create productivity barriers. Customers experiencing process pain points are typically seeking ways to streamline operations, reduce manual efforts, or eliminate bottlenecks that impede their team's effectiveness.
3. Support Pain Points
When customers struggle with inadequate guidance or confusing information, they experience support pain points. These frustrations often manifest as difficulties in finding answers to questions, navigating complex systems without assistance, or receiving inconsistent help when problems arise.
4. Product Pain Points
Product pain points stem from gaps in features, usability challenges, or integration difficulties. Customers facing these issues may find that existing solutions don't fully address their needs or create new problems in their attempt to solve others.
Understanding the psychology behind these frustrations is crucial. I've noticed that unaddressed pain points directly impact customer loyalty and retention. When customers feel their challenges are ignored or minimized, they begin seeking alternatives – often without explicitly stating their dissatisfaction first.
Using customer conversations as input, I've been able to create visual customer personas with PageOn.ai's AI Blocks that illustrate different pain point profiles. These visualizations help sales teams recognize patterns and develop more targeted approaches.

By categorizing and analyzing customer pain points systematically, we create the foundation for developing targeted visual solutions that resonate with prospects and demonstrate a deep understanding of their challenges.
Effective Pain Point Discovery Techniques
I've found that uncovering customer pain points requires more than just asking direct questions. It demands a systematic approach that combines active listening, strategic questioning, and careful observation.
Systematic Pain Point Discovery
In my experience, the most effective discovery approaches combine several complementary techniques:
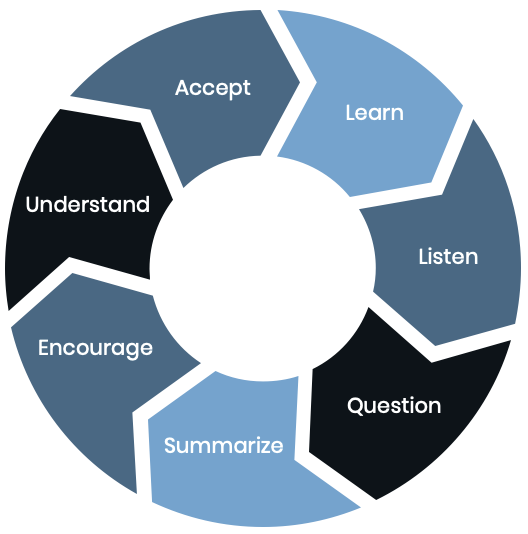
Active Listening Strategies
Active listening goes beyond hearing words – it involves understanding the emotional undertones and unspoken concerns. I practice techniques like reflective listening (paraphrasing what I've heard to confirm understanding) and empathetic acknowledgment (validating the customer's experience). These approaches often reveal underlying frustrations that customers might not explicitly state.
Strategic Question Frameworks
I've developed a question framework that helps me go beyond surface-level objections to uncover root causes:
flowchart TD
    A[Pain Point Discovery Process] --> B[Initial Symptom Questions]
    B --> C[Consequence Questions]
    C --> D[Root Cause Questions]
    D --> E[Impact Questions]
    E --> F[Ideal State Questions]
    B --> B1["What challenges are you currently facing?"]
    B --> B2["Which processes take the most time?"]
    C --> C1["How is this issue affecting your team/results?"]
    C --> C2["What happens when this problem occurs?"]
    D --> D1["What do you believe is causing this issue?"]
    D --> D2["When did you first notice this problem?"]
    E --> E1["How does this impact your goals/metrics?"]
    E --> E2["What's the cost of not solving this?"]
    F --> F1["In an ideal world, how would this work?"]
    F --> F2["What would success look like here?"]
    classDef orange fill:#FF8000,stroke:#333,stroke-width:1px,color:white;
    class A orange
Observation Techniques
Sometimes, the most revealing pain points are communicated non-verbally. I pay close attention to hesitations, changes in tone, body language shifts, and emotional responses during discussions. These signals often point to areas of significant frustration that customers may have difficulty articulating.
For structuring discovery calls, I create visual conversation guides using PageOn.ai's Vibe Creation tool. These guides help me maintain a natural flow while ensuring I cover all essential areas for pain point identification. The visual format makes it easier to navigate complex conversations without seeming scripted.

Industry-Specific Pain Point Mapping
Different industries experience unique challenges. I've mapped common pain points across sectors to help sales teams prepare more targeted discovery approaches:
I've found that leveraging PageOn.ai's Deep Search functionality allows me to integrate relevant industry data that validates common pain points. This evidence-based approach builds credibility during discovery conversations and helps customers feel understood.
By implementing these discovery techniques, I can consistently uncover the pain points that matter most to customers, creating the foundation for persuasive visual solutions that directly address their specific challenges.
Transforming Pain Points into Persuasive Visual Solutions
Once I've identified customer pain points, the next critical step is transforming those insights into compelling visual narratives that clearly illustrate how our solutions address their specific challenges.
Pain-to-Solution Framework
I've developed a systematic framework for translating different types of pain points into targeted visual solutions:
| Pain Point Category | Visualization Approach | Example Application |
|---|---|---|
| Financial Pain Points | ROI Visualization Techniques | Time-to-value charts, cost comparison graphs, investment return timelines |
| Process Pain Points | Before/After Workflow Demonstrations | Process flow diagrams, time-saving visualizations, efficiency gain charts |
| Support Pain Points | Visual Customer Success Roadmaps | Support journey maps, knowledge base visualizations, training path flowcharts |
| Product Pain Points | Feature Benefit Illustrations | Feature comparison matrices, integration diagrams, usability enhancement visuals |
I've found that sales presentation ideas that visually contrast the "pain state" versus the "solution state" are particularly effective in helping customers envision the transformation our products can deliver.
Process Pain Point Transformation
flowchart TD
    subgraph "Pain State"
        A1[Manual Data Entry] -->|Time-consuming| B1[Spreadsheet Creation]
        B1 -->|Error-prone| C1[Manual Calculations]
        C1 -->|Delays| D1[Report Generation]
        D1 -->|Incomplete insights| E1[Decision Making]
    end
    subgraph "Solution State"
        A2[Automated Data Capture] -->|Real-time| B2[Intelligent Processing]
        B2 -->|Accuracy| C2[Automated Analysis]
        C2 -->|Instant| D2[Dynamic Reporting]
        D2 -->|Data-driven| E2[Strategic Decisions]
    end
    E1 -.->|Transform with Solution| A2
Impact Metrics Visualization
Quantifying the value of resolving specific pain points is essential for building a persuasive case. I create impact metrics visualizations that clearly illustrate the before-and-after differences in key performance indicators:
Using PageOn.ai's visualization capabilities, I can transform complex customer challenges into clear visual narratives that make the benefits of our solutions immediately apparent. This approach is particularly effective for impactful product presentations that need to quickly communicate value.
By creating visual expressions that directly address identified pain points, I build a compelling case for how our solutions transform frustrations into opportunities for improvement and growth.
Crafting Pain-Based Sales Presentations That Convert
I've learned that the most effective sales presentations are structured around customer pain points, with each section deliberately addressing specific challenges and demonstrating clear solutions.

Pain-Based Presentation Structure
When designing presentations that address customer pain points, I follow a specific structure that builds emotional connection before introducing solutions:
flowchart TD
    A[Pain-Based Presentation Structure] --> B[Pain Acknowledgment]
    B --> C[Impact Quantification]
    C --> D[Solution Introduction]
    D --> E[Transformation Visualization]
    E --> F[Proof & Validation]
    F --> G[Implementation Simplicity]
    G --> H[Call to Action]
    B --> B1["Validate customer's experience"]
    B --> B2["Show deep understanding"]
    C --> C1["Quantify business impact"]
    C --> C2["Illustrate opportunity cost"]
    D --> D1["Introduce solution capabilities"]
    D --> D2["Map features to pain points"]
    E --> E1["Before/After comparisons"]
    E --> E2["Visual transformation stories"]
    F --> F1["Customer success stories"]
    F --> F2["Relevant metrics & outcomes"]
    G --> G1["Simplified implementation path"]
    G --> G2["Quick time-to-value"]
    H --> H1["Clear next steps"]
    H --> H2["Value-focused proposal"]
    classDef orange fill:#FF8000,stroke:#333,stroke-width:1px,color:white;
    class A,H orange
Visual Storytelling Techniques
I've found that visual storytelling creates emotional connections with customer frustrations more effectively than text alone. Using PageOn.ai, I transform abstract pain points into concrete visual metaphors that resonate with decision-makers.
For example, when addressing process inefficiency pain points, I might create a visual showing a maze with multiple dead ends to represent the current state, contrasted with a clear, direct path representing the solution state. These persuasive speech ideas translated into visuals help make abstract concepts tangible.

Incorporating Customer Testimonial Visuals
Nothing validates pain resolution like stories from customers who have experienced transformation. I create compelling testimonial visuals that reinforce success stories:
Sarah Chen
Operations Director, TechCorp
"Our manual reporting process was taking 20+ hours weekly. After implementing the solution, we've reduced this to just 3 hours – an 85% time savings that transformed our team's productivity."
Marcus Johnson
CFO, Retail Innovations
"We struggled to justify technology investments to stakeholders. The ROI visualization tools helped us clearly demonstrate a 250% return within 18 months, securing immediate budget approval."
By structuring presentations around pain points and using visual storytelling techniques, I create compelling narratives that resonate with customers' experiences and clearly demonstrate how our solutions address their specific challenges.
Real-World Application: Industry-Specific Pain Point Solutions
Different industries face unique challenges that require tailored visual approaches. I've developed specific techniques for addressing pain points across various sectors.
Retail Sector Solutions
In the retail sector, I frequently encounter specific pain points that can be addressed through targeted visual solutions:
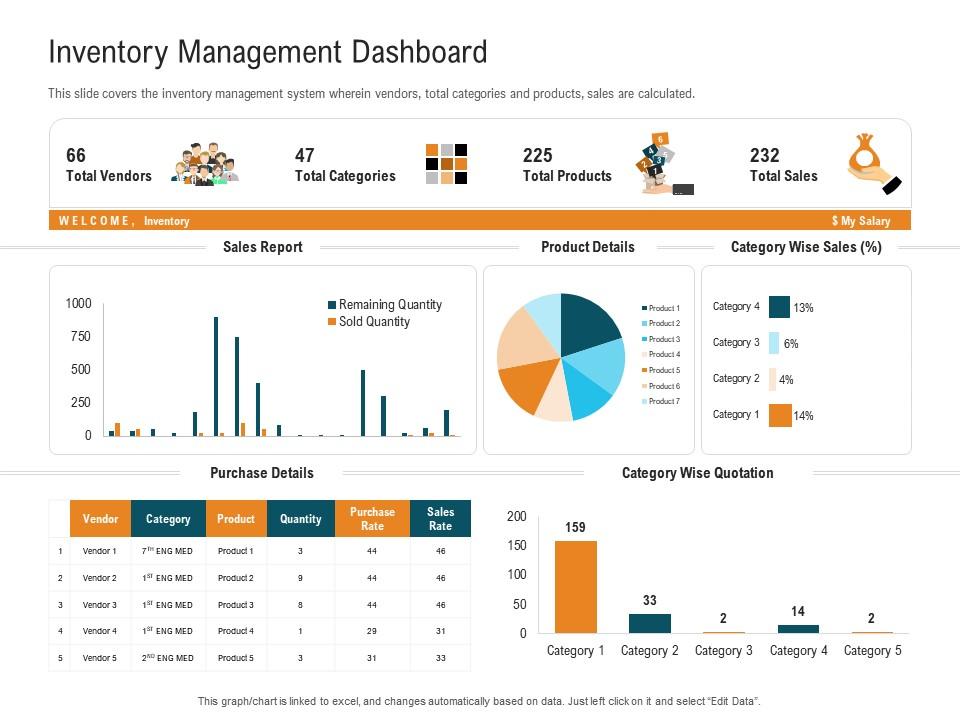
Inventory Management Pain Points
Retailers often struggle with inventory optimization – balancing stock levels to avoid both stockouts and excess inventory. I create visual stock optimization tools that illustrate ideal inventory levels based on historical sales data, seasonal trends, and demand forecasting. These visualizations help retailers see precisely where adjustments are needed.
Product Information Pain Points
According to research on customer pain points, inadequate product information is a significant challenge in retail. Food items without proper ingredient listings or missing key product attributes like "gluten-free" can lead to lost sales. I develop product information visualizations that highlight critical details and create a more informative shopping experience.
Size Availability Challenges
For apparel retailers, consistent size availability is crucial for customer retention. I create size availability forecasting visuals that help retailers anticipate demand patterns and maintain appropriate stock levels across all sizes.
B2B Services Solutions
B2B service providers face different pain points that require specialized visual approaches:
B2B Implementation Timeline
gantt
    title Implementation Process Simplified
    dateFormat  YYYY-MM-DD
    axisFormat %b %d
    section Discovery
    Requirements Gathering    :a1, 2023-01-01, 14d
    Solution Design           :a2, after a1, 10d
    section Implementation
    Configuration             :b1, after a2, 21d
    Data Migration            :b2, after a2, 28d
    section Training
    Admin Training            :c1, after b1, 7d
    End User Training         :c2, after c1, 14d
    section Go-Live
    Final Testing             :d1, after b2, 7d
    Launch                    :milestone, after d1, 0d
    section Support
    Post-Launch Support       :e1, after d1, 30d
ROI Calculation for Budget Justification
B2B decision-makers often face financial pain points related to budget justification. I design ROI calculation visuals that clearly illustrate the financial benefits of implementing our solutions, helping stakeholders make a compelling case for investment.
Implementation Complexity Concerns
Process pain points in B2B often revolve around implementation complexity fears. My implementation timeline visuals address these concerns by breaking down the process into manageable phases with clear timelines and milestones.
Competitive Differentiation Challenges
B2B services often struggle to clearly articulate their unique value proposition. I develop visual competitive analysis frameworks that highlight key differentiators and make it easy for prospects to see the advantages of choosing our solution.
By tailoring visual solutions to industry-specific pain points, I create more relevant and impactful presentations that resonate with the unique challenges faced by different sectors.
Measuring Pain Point Resolution Success
To demonstrate the effectiveness of pain point resolution strategies, I establish clear metrics and visualization frameworks that track progress and outcomes.
Key Performance Indicators for Pain Resolution
I track several critical KPIs to measure the effectiveness of pain point resolution:
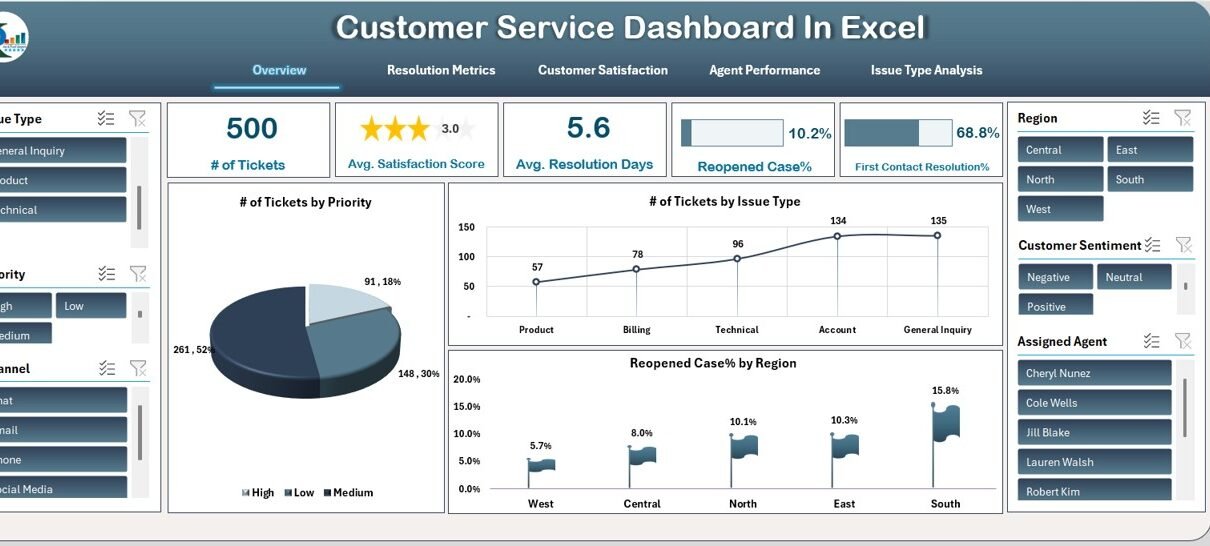
Customer Satisfaction Visualization
Using PageOn.ai, I create customer satisfaction visualization dashboards that track how effectively our solutions address identified pain points. These dashboards incorporate multiple data sources:
- Customer satisfaction surveys specifically focused on pain point resolution
- Support ticket analysis tracking the frequency of pain-related issues
- Usage metrics showing adoption of pain-resolving features
- Customer retention rates correlated with pain point resolution
Feedback Collection Mechanisms
To continuously improve our pain point resolution approach, I develop feedback collection mechanisms that identify emerging challenges:
flowchart TD
    A[Feedback Collection System] --> B[Automated Surveys]
    A --> C[Support Interaction Analysis]
    A --> D[Usage Pattern Monitoring]
    A --> E[Customer Advisory Panels]
    B --> B1[Post-Implementation Survey]
    B --> B2[Quarterly Check-In]
    B --> B3[Feature-Specific Feedback]
    C --> C1[Support Ticket Categorization]
    C --> C2[Sentiment Analysis]
    C --> C3[Recurring Issue Identification]
    D --> D1[Feature Adoption Tracking]
    D --> D2[Workflow Completion Rates]
    D --> D3[Abandonment Pattern Analysis]
    E --> E1[Quarterly Review Sessions]
    E --> E2[Pain Point Prioritization]
    E --> E3[Solution Co-Creation]
    classDef orange fill:#FF8000,stroke:#333,stroke-width:1px,color:white;
    class A orange
Implementing a strategic sales plan that connects pain resolution to revenue impact is crucial. I develop visual reporting tools that clearly demonstrate this relationship, helping organizations see the direct business benefits of addressing customer pain points effectively.
By establishing comprehensive measurement frameworks, I ensure that pain point resolution efforts are data-driven and continuously improving to address evolving customer needs.
Building a Pain-Focused Sales Culture
Creating a sales organization that consistently identifies and addresses customer pain points requires a deliberate cultural approach and supporting tools.
Training Sales Teams on Pain Recognition
I've developed training programs that help sales teams recognize and document customer pain signals. These programs focus on:
- Active listening techniques that identify subtle pain indicators
- Question frameworks designed to uncover hidden frustrations
- Documentation practices that capture pain points systematically
- Analysis methods that connect pain points to solution capabilities
Pain Point Library Development
A centralized pain point library with corresponding visual solution templates accelerates the sales team's ability to address common challenges:
Financial Pain Library
- • Budget constraint templates
- • ROI justification visuals
- • Cost comparison frameworks
- • Value demonstration charts
Process Pain Library
- • Workflow optimization visuals
- • Time-saving calculation tools
- • Efficiency comparison charts
- • Automation benefit diagrams
Support Pain Library
- • Knowledge access visuals
- • Training path illustrations
- • Support response comparisons
- • Self-service enablement tools
Collaborative Pain Resolution Workflows
I create collaborative workflows for sharing successful pain resolution approaches across the organization:
flowchart TD
    A[Pain Resolution Workflow] --> B[Pain Point Identification]
    B --> C[Solution Mapping]
    C --> D[Visual Asset Creation]
    D --> E[Presentation & Feedback]
    E --> F[Outcome Documentation]
    F --> G[Library Update]
    G --> H[Team Knowledge Sharing]
    H --> I[Continuous Improvement]
    I -.-> B
    B --> B1[Customer Interview]
    B --> B2[Signal Documentation]
    B --> B3[Pain Categorization]
    C --> C1[Feature Matching]
    C --> C2[Value Proposition]
    C --> C3[Solution Design]
    D --> D1[PageOn.ai Template]
    D --> D2[Custom Visualization]
    D --> D3[Before/After Creation]
    classDef orange fill:#FF8000,stroke:#333,stroke-width:1px,color:white;
    class A,D1 orange
PageOn.ai as a Central Pain Resolution Platform
I implement PageOn.ai as the central platform for pain point visualization and solution development, enabling teams to:
- Create consistent visual representations of customer pain points
- Develop and share solution visualizations that address specific challenges
- Collaborate on pain-to-solution frameworks across teams
- Build a centralized library of effective visual assets
By fostering a pain-focused sales culture and providing the tools necessary for consistent execution, organizations can transform their approach to customer engagement and significantly improve their ability to address customer challenges effectively.
Transform Your Customer Pain Points into Visual Sales Success
Discover how PageOn.ai can help you create compelling visual narratives that address customer pain points and drive sales conversions.
Start Creating with PageOn.ai TodayThe Power of Visual Pain Point Resolution
Throughout this guide, I've explored how transforming customer pain points into visual sales narratives creates more compelling and effective sales conversations. By systematically identifying pain points, creating targeted visual solutions, and measuring resolution effectiveness, sales teams can significantly improve their ability to address customer challenges.
The most successful sales professionals don't just sell products or services – they solve problems. By adopting a pain-focused approach and leveraging visualization tools like PageOn.ai, you can create sales presentations that resonate deeply with customer challenges and clearly demonstrate the transformative value of your solutions.
Remember that pain point resolution is an ongoing process. Customer needs evolve, new challenges emerge, and effective sales organizations continuously refine their approach to addressing these changing pain points. By building a pain-focused sales culture supported by powerful visualization tools, you can create a sustainable competitive advantage that drives long-term customer loyalty and business growth.
Start transforming your customer pain points into persuasive visual sales narratives today, and watch your conversion rates and customer satisfaction metrics improve dramatically.
You Might Also Like
Audience-Centered Pitching Techniques: Visual Strategies That Win Every Time
Discover powerful audience-centered pitching techniques using visual storytelling, interactive engagement, and benefit visualization strategies that consistently win over any audience.
Beyond "Today I'm Going to Talk About": Creating Memorable Presentation Openings
Transform your presentation openings from forgettable to captivating. Learn psychological techniques, avoid common pitfalls, and discover high-impact alternatives to the 'Today I'm going to talk about' trap.
Multi-Format Conversion Tools: Transforming Modern Workflows for Digital Productivity
Discover how multi-format conversion tools are revolutionizing digital productivity across industries. Learn about essential features, integration strategies, and future trends in format conversion technology.
The Art of Instant Connection: Crafting Opening Strategies That Captivate Any Audience
Discover powerful opening strategies that create instant audience connection. Learn visual storytelling, interactive techniques, and data visualization methods to captivate any audience from the start.