Transforming Database Design: How AI Visualization Streamlines Schema Creation
The Evolution of Database Design Tools
Database design has undergone a remarkable transformation in recent years. What once required painstaking hours of manual entity-relationship diagram creation can now be accomplished in minutes through AI-powered visualization tools. This shift is fundamentally changing how developers, database administrators, and even non-technical stakeholders interact with database architecture.
The Evolution of Database Design Tools
I've spent countless hours hunched over whiteboards and paper, meticulously drawing entity-relationship diagrams for database projects. Traditional database design was a labor-intensive process that required careful planning and manual creation of visual schemas. The evolution from these manual methods to today's AI-assisted tools represents one of the most significant advancements in database development.
The evolution of database design tools over time
ChatDiagram and similar AI-powered tools are revolutionizing how we approach database design workflows. These tools leverage natural language processing to interpret requirements and automatically generate visual representations of database schemas. This shift is particularly important as integrate ChatGPT with enterprise data becomes increasingly common in modern development environments.
The growing need for visual database schema representation stems from several factors:
- Increasingly complex data relationships in modern applications
- Cross-functional teams requiring clear communication about data structures
- Agile development methodologies demanding rapid iteration of database designs
- The rise of microservices architectures with distributed data stores
As databases have grown more complex and teams more diverse, the ability to quickly visualize and communicate database architecture has become essential. This is where AI-powered tools are making their most significant impact.
Understanding AI-Powered Database Visualization
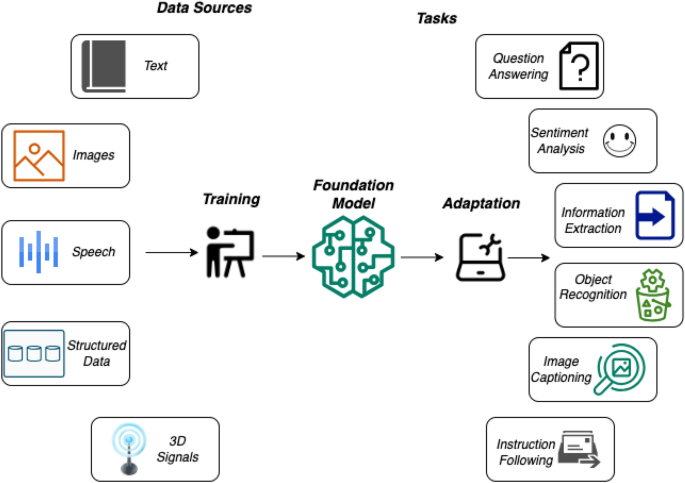
At the heart of tools like ChatDiagram lies sophisticated natural language processing (NLP) technology. These systems can interpret plain language descriptions of database requirements and translate them into structured visual representations. The process involves parsing text to identify entities, attributes, relationships, and constraints—then mapping these elements to appropriate visual notations.
How NLP Powers Database Visualization
flowchart TD
    A[Natural Language Input] -->|Parse Text| B[Entity Recognition]
    A -->|Extract| C[Relationship Identification]
    A -->|Determine| D[Attribute Assignment]
    B & C & D --> E[Schema Structure Creation]
    E -->|Apply Notation Rules| F[Visual Diagram Generation]
    F --> G[Interactive Visualization]
    style A fill:#FF8000,stroke:#333,stroke-width:1px,color:white
    style G fill:#FF8000,stroke:#333,stroke-width:1px,color:white
Modern AI visualization tools support various diagram types to represent database structures. The most common include:
Entity-Relationship Diagrams (ERDs)
Shows entities, attributes, and relationships between different data objects
Schema Diagrams
Represents the logical structure of a database with tables, fields, and connections
Relationship Mappings
Focuses on visualizing connections and dependencies between data elements
Notation Styles Comparison
| Notation Style | Best Use Cases | Strengths | Limitations |
|---|---|---|---|
| Chen Notation | Conceptual modeling, academic contexts | Clear representation of entities and relationships | Can become cluttered with complex schemas |
| Crow's Foot | Professional database design, industry standard | Intuitive cardinality representation | Less emphasis on entity attributes |
| Bachman Notation | Network database models | Good for hierarchical relationships | Less common, steeper learning curve |
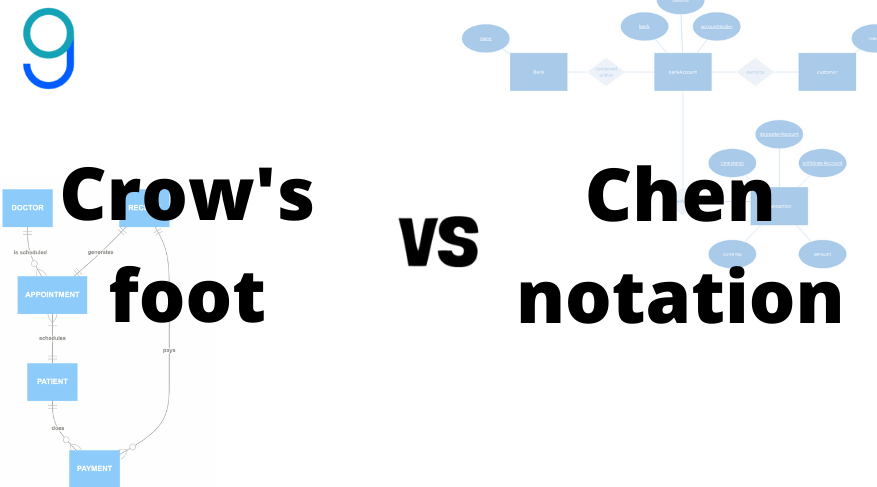
Visual comparison of different ERD notation styles
Each notation style serves specific purposes, and modern AI tools like ChatDiagram can typically generate diagrams in multiple formats based on user preferences and project requirements. This flexibility allows teams to choose the most appropriate visualization method for their specific audience and use case.
Key Benefits of Automated Database Design
I've experienced firsthand the transformative benefits of switching from manual database design to AI-assisted visualization. The advantages extend far beyond mere convenience, offering tangible improvements to the entire database development lifecycle.
Time Efficiency
What once took hours or even days of manual work can now be accomplished in minutes. This dramatic time reduction allows teams to focus on more strategic aspects of database design rather than the mechanics of diagram creation. In my projects, I've seen design time reductions of up to 75% when using AI visualization tools.
Error Reduction
Automated tools excel at detecting inconsistencies, redundancies, and potential issues in database relationships. By validating relationships and enforcing design rules, these tools help eliminate common errors that can be difficult to spot manually, especially in complex schemas.
Design Consistency
AI-powered tools apply consistent design patterns and notation styles across projects. This standardization improves documentation quality and makes it easier for team members to understand database structures across different systems.
Technical Accessibility
Perhaps one of the most transformative benefits is how these tools democratize database design. Team members with varying technical expertise can now contribute meaningfully to database architecture discussions, as the visual nature of the output makes complex structures more accessible.
Real-time Visualization of Complex Structures
erDiagram
    CUSTOMER ||--o{ ORDER : places
    CUSTOMER {
        string id PK
        string name
        string email
        string address
    }
    ORDER ||--|{ ORDER_ITEM : contains
    ORDER {
        string id PK
        string customer_id FK
        date order_date
        string status
    }
    PRODUCT ||--o{ ORDER_ITEM : "ordered in"
    PRODUCT {
        string id PK
        string name
        float price
        string category
    }
    ORDER_ITEM {
        string order_id FK
        string product_id FK
        integer quantity
    }
An automatically generated E-commerce database schema using PageOn.ai's AI Blocks
PageOn.ai's AI Blocks feature takes these benefits even further by enabling real-time visualization of complex database structures. This allows for immediate feedback during design sessions and facilitates more effective communication between technical and non-technical stakeholders. The ability to quickly iterate on visual designs encourages experimentation and optimization before any code is written.
Practical Implementation of ChatDiagram
Getting started with ChatDiagram is remarkably straightforward. The tool is designed to be intuitive while providing powerful database visualization capabilities. Here's how I approach setting up and using ChatDiagram for database projects.

ChatDiagram interface showing natural language input and resulting visualization
Input Methods
Natural Language Description
One of the most powerful features is the ability to describe your database in plain English. For example:
From this simple description, ChatDiagram can generate a complete entity-relationship diagram with appropriate relationships and cardinality.
Importing Existing Structures
For existing databases, ChatDiagram can import and visualize schema definitions. Simply paste your SQL schema definitions, and the tool will automatically analyze the structure and generate a corresponding diagram. This feature is particularly valuable for presentation automation with ChatGPT when explaining existing database architectures to stakeholders.
Iterative Refinement
The conversational interface allows for iterative refinement of your database design. You can request changes, add constraints, or modify relationships through natural language commands:
The diagram updates in real-time, allowing for rapid iteration and experimentation.
Customization Options
Notation Style
Specify your preferred notation (Chen, Crow's Foot, Bachman)
Color Schemes
Customize entity colors for better visual organization
Detail Level
Toggle between simplified and detailed views
Layout Options
Adjust spacing, orientation, and arrangement of entities
Integration Capabilities
ChatDiagram doesn't exist in isolation. It's designed to integrate with existing database management systems and development workflows:
- Export diagrams to popular formats (PNG, SVG, PDF)
- Generate SQL scripts directly from visual diagrams
- Integration with version control systems
- API access for embedding in custom workflows
Using PageOn.ai's Deep Search feature alongside ChatDiagram creates a powerful combination for database design. Deep Search can help identify optimal design patterns for specific use cases by analyzing similar database architectures across industries. This knowledge-driven approach ensures your database designs follow best practices while addressing your unique requirements.
Advanced Features for Database Professionals
For database professionals seeking to maximize productivity and design quality, ChatDiagram offers a suite of advanced features that go beyond basic visualization.
Automated SQL Generation
One of the most time-saving features is the ability to automatically generate SQL code from visual diagrams. This bidirectional capability means you can:
- Generate complete CREATE TABLE statements
- Create foreign key constraints
- Define indexes and other optimization structures
- Generate documentation comments
Generated SQL Example:
CREATE TABLE customers (
  id VARCHAR(50) PRIMARY KEY,
  name VARCHAR(100) NOT NULL,
  email VARCHAR(100) UNIQUE NOT NULL,
  address TEXT
);
CREATE TABLE orders (
  id VARCHAR(50) PRIMARY KEY,
  customer_id VARCHAR(50) NOT NULL,
  order_date DATE NOT NULL,
  status VARCHAR(20) NOT NULL,
  FOREIGN KEY (customer_id)
    REFERENCES customers(id)
);
-- Additional tables and relationships...
Version Control and Change Tracking
Database schemas evolve over time, and tracking these changes is crucial for maintaining system integrity. Advanced features include:
gitGraph
    commit id: "Initial Schema"
    branch feature-user-profiles
    checkout feature-user-profiles
    commit id: "Add user preferences table"
    commit id: "Add profile image support"
    checkout main
    merge feature-user-profiles
    branch performance-updates
    checkout performance-updates
    commit id: "Add indexes to order queries"
    checkout main
    merge performance-updates
    commit id: "Final schema v1.0"
Version control visualization for database schema changes
- Schema versioning with visual diff comparisons
- Branching for experimental schema changes
- Change history with annotations and comments
- Rollback capabilities for reverting problematic changes
Collaborative Design Features
Modern database design is rarely a solo endeavor. ChatDiagram supports team-based design through:
Real-time Collaboration
Multiple team members can work on the same diagram simultaneously
Comment Threading
Discuss specific entities or relationships within the context of the diagram
Approval Workflows
Formalize the review and approval process for schema changes
Performance Optimization Suggestions
Beyond just visualizing structure, advanced AI tools can now provide intelligent suggestions for database optimization:

AI-powered performance optimization recommendations
- Indexing recommendations based on query patterns
- Normalization analysis and suggestions
- Identification of potential bottlenecks
- Data type optimization recommendations
PageOn.ai's Agentic capabilities take database design to the next level by transforming complex requirements into visual representations. The system can analyze requirements documents, identify entities and relationships, and suggest optimal database structures—all while maintaining a visual representation that evolves as requirements are refined. This creates a powerful feedback loop between requirements and design that accelerates development and improves quality.
Case Studies: From Concept to Implementation
The true value of AI-powered database visualization becomes apparent when examining real-world applications. I've collected several compelling case studies that demonstrate the transformative impact of these tools.
Fintech Startup: 75% Reduction in Database Design Time
A rapidly growing fintech startup needed to design a complex transaction processing system with strict regulatory compliance requirements. Their challenges included:
- Multiple interconnected entities with complex relationships
- Strict data integrity and audit trail requirements
- Need for quick iterations to support evolving business requirements
By implementing ChatDiagram, they were able to:
- Reduce database design time from 4 weeks to 1 week
- Easily visualize complex transaction flows for compliance reviews
- Quickly iterate on designs based on stakeholder feedback
- Generate compliant SQL scripts automatically
"The ability to describe our complex financial data relationships in natural language and immediately see them visualized saved us countless hours and improved our communication with regulators." — CTO, Fintech Startup
Enterprise Migration: Visualizing Legacy Database Structures
A large enterprise undertaking a modernization initiative faced the challenge of understanding and migrating decades-old database systems. Using AI chat with pictures capabilities, they were able to:
- Automatically generate visual representations of legacy schemas by importing SQL scripts
- Identify redundancies and optimization opportunities in the legacy structure
- Create clear before-and-after visualizations for stakeholder presentations
- Maintain data lineage tracking throughout the migration process
Educational Application: Teaching Database Concepts
A university computer science department incorporated ChatDiagram into their database design curriculum. The interactive nature of the tool allowed students to:
- Experiment with different database designs in real-time
- Visualize the impact of normalization on database structure
- Generate and analyze SQL code from their visual designs
- Collaborate on team projects with version control
The results were impressive:
- 25% improvement in student comprehension of relational database concepts
- Increased student engagement and satisfaction
- More complex and sophisticated student projects
Communicating with Non-Technical Stakeholders
A healthcare software company used PageOn.ai's Vibe Creation feature to transform complex patient data models into intuitive visualizations for hospital administrators. This approach:

Technical schema vs. stakeholder-friendly visualization
- Simplified complex relationships without losing critical information
- Used domain-specific visual language (medical icons, intuitive color coding)
- Enabled non-technical stakeholders to provide valuable input on data structure
- Facilitated faster approval processes and implementation timelines
These case studies demonstrate that AI-powered database visualization tools deliver value across diverse scenarios—from startups to enterprises, from technical implementation to education and stakeholder communication. The common thread is increased efficiency, improved communication, and better database designs.
Overcoming Limitations and Challenges
While AI-powered database visualization tools offer tremendous benefits, they're not without limitations. Understanding these challenges and knowing when to supplement with manual intervention is crucial for successful implementation.
Handling Complex Relationships
Extremely complex database relationships can sometimes challenge AI visualization tools. When dealing with:
- Polymorphic associations
- Hierarchical self-referencing relationships
- Complex many-to-many relationships with attributes
- Temporal or historical data tracking
"We found that breaking down highly complex schemas into logical subsystems before visualization helped the AI generate more accurate and understandable diagrams. This divide-and-conquer approach worked well for our enterprise data warehouse project." — Database Architect
Ensuring Accuracy
While AI tools are increasingly accurate, verification remains important. Best practices include:
- Having database experts review generated schemas for logical consistency
- Testing generated SQL scripts in development environments before production
- Verifying that all business requirements are properly represented
- Using Bing AI chat content generation to validate design assumptions
Managing Edge Cases
flowchart TD
    A[Identify Edge Case] -->|Document| B[Attempt AI Solution]
    B -->|Success?| C{Evaluate Results}
    C -->|Yes| D[Incorporate into Design]
    C -->|No| E[Manual Intervention]
    E --> F[Create Custom Solution]
    F --> G[Document for Future AI Training]
    G --> D
    D --> H[Validate with Testing]
Process for handling edge cases in AI database design
Common edge cases that may require special attention include:
- Industry-specific compliance requirements
- Unusual data types or custom extensions
- Legacy compatibility requirements
- Highly specialized domain models
When Manual Intervention Is Necessary
Despite the power of AI visualization tools, there are scenarios where manual intervention remains valuable:
| Scenario | Recommended Approach |
|---|---|
| Highly specialized domain knowledge | Expert review and refinement of AI-generated initial design |
| Performance-critical systems | Manual optimization of AI-suggested indexing and structure |
| Regulatory compliance verification | Human compliance expert review of generated schemas |
| Novel architectural patterns | Collaborative approach between AI suggestions and human innovation |
The most effective approach combines the efficiency of AI-powered visualization with strategic human oversight. This hybrid model leverages the strengths of both automated tools and human expertise, resulting in database designs that are both efficient to create and optimized for real-world performance.
Future Directions in AI-Assisted Database Design
The field of AI-assisted database design is evolving rapidly. Looking ahead, several promising trends and developments are likely to shape the future of tools like ChatDiagram and PageOn.ai.

Conceptual view of future AI database design interfaces
Integration with Development Workflows
We're seeing increasing integration between AI visualization tools and broader development environments:
- Native plugins for popular IDEs and development environments
- Integration with CI/CD pipelines for automated schema validation
- Compatibility with infrastructure-as-code frameworks
- Direct connections to database migration tools
Predictive Database Optimization
Future AI tools will likely incorporate predictive capabilities:
flowchart TD
    A[Database Schema] -->|Analysis| B[Usage Pattern Recognition]
    B --> C[Workload Simulation]
    C --> D[Performance Prediction]
    D --> E[Automated Optimization Suggestions]
    E --> F[Self-Tuning Database]
    style A fill:#FF8000,stroke:#333,stroke-width:1px,color:white
    style F fill:#FF8000,stroke:#333,stroke-width:1px,color:white
Predictive optimization workflow
- Predictive query performance analysis based on schema design
- Automated index and optimization recommendations
- Workload-specific schema optimization suggestions
- Capacity planning and scaling recommendations
Cross-Platform Visualization Capabilities
As data ecosystems become more diverse, visualization tools will expand to support:
Multi-Database Visualization
Unified views across different database types (SQL, NoSQL, Graph)
Data Lineage Tracking
Visualizing how data flows through complex systems
AR/VR Visualization
Immersive exploration of complex database architectures
AI in Database Maintenance and Evolution
The role of AI will extend beyond initial design to ongoing maintenance:
- Automated schema evolution recommendations based on changing data patterns
- Intelligent migration planning for system upgrades
- Anomaly detection in database usage and performance
- Continuous optimization suggestions as applications evolve
PageOn.ai is at the forefront of these developments, with continuous improvements that enhance the database visualization experience. The platform's commitment to integrating cutting-edge AI capabilities with intuitive visualization tools positions it as a leader in this evolving landscape. As AI models become more sophisticated and domain-aware, we can expect even more powerful tools that further bridge the gap between conceptual database design and optimized implementation.
Getting Started: A Step-by-Step Guide
Ready to transform your database design process with AI visualization? Here's a practical guide to get you started.
Choosing the Right AI Visualization Tool
When selecting a tool for your database visualization needs, consider these factors:
| Factor | Considerations |
|---|---|
| Database Types | Ensure support for your specific database systems (MySQL, PostgreSQL, MongoDB, etc.) |
| Team Size | Consider collaboration features for larger teams |
| Integration Needs | Check compatibility with your existing development tools |
| Complexity Level | Match tool capabilities to your schema complexity |
| Budget | Consider free tiers for experimentation before committing |
Converting Your First Database Concept
Follow these steps to create your first AI-generated database visualization:
-
Define your database requirements
Start with a clear understanding of what entities and relationships your database needs to represent. Consider creating a simple text description of the core functionality.
-
Choose your input method
Decide whether to use natural language description, import an existing schema, or start with a template.
-
Generate your initial visualization
Input your requirements and let the AI create the first version of your database diagram.
-
Review and refine
Carefully examine the generated diagram for accuracy and completeness. Use the iterative capabilities to make adjustments.
-
Export and share
Once satisfied, export your diagram in your preferred format and share it with stakeholders.
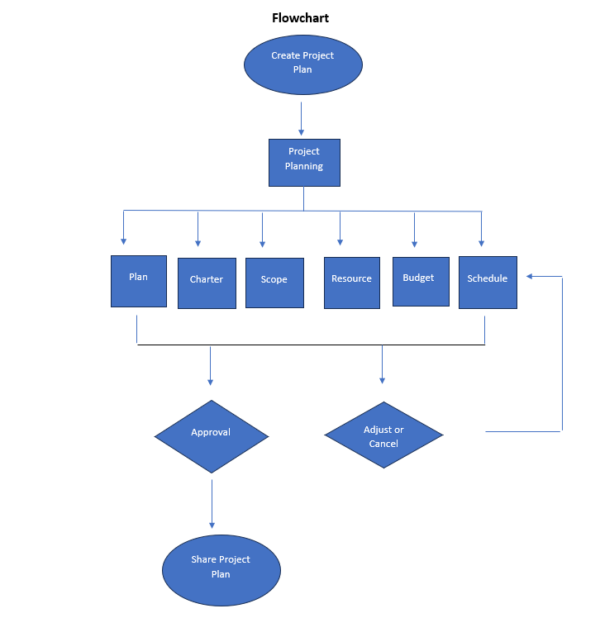
Complete workflow from requirements to implementation
Best Practices for Clear Instructions
The quality of AI-generated diagrams often depends on the clarity of your instructions. Here are some tips for providing effective guidance to ChatDiagram:
Effective Instructions
- "Create a database for an e-commerce platform with customers, products, orders, and payments. Customers can have multiple orders, each containing multiple products. Track payment status for each order."
- "Generate an ERD for a hospital system where patients can have multiple appointments with different doctors. Include medical records linked to patients and prescription information."
Less Effective Instructions
- "Make me a database diagram" (too vague, lacks specifics)
- "I need a complex system with many tables and relationships for my business" (insufficient detail about actual entities and relationships)
Iterative Refinement Techniques
For complex database structures, an iterative approach often yields the best results:
-
Start with core entities
Begin by defining your primary entities and their basic relationships.
-
Add detail incrementally
Gradually introduce additional attributes, constraints, and secondary entities.
-
Use specific refinement commands
For example: "Add a 'status' field to the order table with possible values: pending, processing, shipped, delivered."
-
Focus on one area at a time
Address specific sections of your schema in sequence rather than attempting to refine everything simultaneously.
-
Validate with test scenarios
Test your design against real-world usage scenarios to identify gaps or issues.
Exporting and Sharing
Once your database design is complete, you can leverage various export options:
- High-resolution images (PNG, JPEG) for documentation
- Vector formats (SVG) for scalable diagrams
- PDF for formal presentations
- SQL scripts for direct implementation
- Interactive web-based formats for team collaboration
By following these guidelines and leveraging the power of AI visualization tools, you can transform your database design process from a time-consuming manual effort into a streamlined, collaborative, and highly efficient workflow. The result will be better-designed databases, clearer communication, and ultimately more robust applications built on solid data foundations.
Transform Your Database Visualizations with PageOn.ai
Ready to revolutionize how you create, share, and implement database designs? PageOn.ai's powerful visualization tools make it easy to transform complex database concepts into clear, compelling visual expressions that everyone can understand.
Start Creating with PageOn.ai TodayConclusion: The Future of Database Design is Visual
As we've explored throughout this guide, AI-powered database visualization tools like ChatDiagram are transforming how we approach database design. By combining natural language processing with powerful visualization capabilities, these tools make database design more accessible, efficient, and collaborative than ever before.
The benefits are clear: reduced design time, fewer errors, improved communication, and ultimately better database architectures. Whether you're a database professional looking to streamline your workflow, a team leader aiming to improve collaboration, or an educator teaching database concepts, these tools offer significant advantages over traditional methods.
As AI technology continues to advance, we can expect even more sophisticated capabilities in the future—from predictive optimization to immersive visualization experiences. By embracing these tools today, you position yourself at the forefront of this exciting evolution in database design methodology.
I encourage you to try AI-powered database visualization for your next project. The time savings alone make it worthwhile, but the improvements in design quality and team collaboration may prove even more valuable in the long run. With tools like PageOn.ai continuing to push the boundaries of what's possible, there's never been a better time to transform your approach to database design through the power of visual expression.
You Might Also Like
Transforming Legal Reasoning: Visual Approaches to Modern Jurisprudence | PageOn.ai
Discover how visual approaches are revolutionizing legal reasoning in modern jurisprudence. Learn practical tools, methodologies, and technological innovations for enhanced legal analysis.
Mastering Live Product Demonstrations in Investor Meetings | Captivating Presentation Guide
Learn how to create powerful live product demonstrations that captivate investors, showcase your product's value, and help secure funding through strategic visual storytelling techniques.
Creating Interactive and Animated Infographics for Enhanced User Engagement
Discover how to transform data into captivating interactive stories through animated infographics. Learn best practices, technical approaches, and tools for creating engaging visual experiences.
PDR Security Framework: Visualizing Protection, Detection & Response Systems
Explore the PDR Security Framework with visual guides to Protection, Detection, and Response systems. Learn implementation strategies with interactive diagrams and actionable insights.