Visualizing America's Debt Threshold: When Economic Scale Meets Fiscal Limits
Understanding when debt becomes unsustainable for the world's largest economy
I've spent years analyzing economic data, and one question consistently emerges: how much debt can the world's largest economy sustainably carry? With the U.S. national debt exceeding $27 trillion and global debt approaching $300 trillion, understanding these thresholds has never been more critical.
The Scale of America's Debt in Global Context
When I examine the United States' fiscal position, the numbers are staggering. According to the Treasury Department, America's national debt has surpassed $27 trillion and continues to climb. To put this in perspective, this figure exceeds the entire annual economic output of the country.

While the absolute number is impressive, the more important metric is the debt-to-GDP ratio, which allows us to compare debt levels across economies of different sizes. This ratio provides a clearer picture of debt sustainability.
Debt-to-GDP Ratios Across Major Economies
The following chart compares GDP multiples (a proxy for measuring national wealth relative to debt) across major economies:
Interestingly, despite concerns about America's debt, the U.S. has a GDP multiple of 4.3, significantly lower than the global average of 6.1. This suggests that America's economy has more capacity to generate wealth relative to its GDP than many other major economies.
The global debt picture is even more concerning. According to the Institute for International Finance, global debt approached $300 trillion in 2021, equivalent to 356% of global GDP. This represents a 30 percentage-point increase in the global debt-to-GDP ratio over just five years.
As the world's largest economy, America's approach to debt management has outsized implications for global financial stability. While the U.S. economy provides a solid foundation for carrying substantial debt, the question remains: at what point does this debt become unsustainable?
Defining "Too Much" Debt: Evolving Economic Perspectives
Determining exactly how much debt is "too much" has been a moving target in economic theory. I've watched as perspectives have shifted dramatically over the past few decades, with once-firm thresholds being reconsidered in light of new evidence.
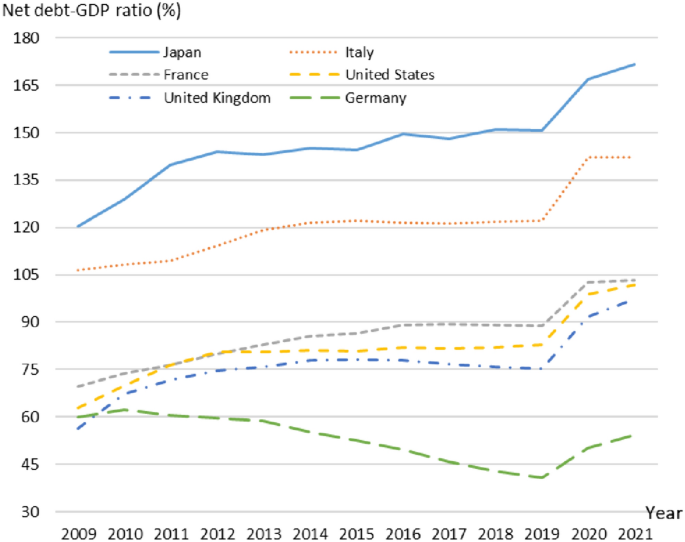
Many economists suggest that when debt reaches 150% to 180% of GDP, serious economic and societal consequences may follow. However, there's considerable debate about whether any fixed threshold truly exists.

In 2010, a highly influential economics paper proposed a "red line" for national debt, suggesting that growth would significantly suffer once debt exceeded 90% of GDP. This theory had profound impacts on fiscal policy worldwide during the aftermath of the global financial crisis.
Evolution of Economic Thinking on Debt Thresholds
The following timeline shows how economic perspectives on debt sustainability have evolved:
                    timeline
                        title Evolution of Debt Threshold Thinking
                        1980s : Moderate Debt Concerns : Focus on balanced budgets
                        1990s : Washington Consensus : Debt viewed as inherently problematic
                        2010 : "90% Red Line" Theory : Paper suggests growth suffers when debt exceeds 90% of GDP
                        2013 : Red Line Theory Questioned : Coding errors and methodological issues discovered
                        2020s : Nuanced Approach : Context-specific thresholds based on multiple factors
However, by 2013, this "red line" theory came under intense scrutiny when researchers identified coding errors and methodological issues in the original analysis. This controversy highlighted the dangers of relying on simplistic thresholds when crafting fiscal policy.
Today, I observe a more nuanced approach to evaluating debt sustainability. Rather than focusing solely on the debt-to-GDP ratio, economists consider several key metrics:
- Interest payments as a percentage of government revenue
- Economic growth rate relative to interest rates
- Currency in which debt is denominated
- Maturity profile of outstanding debt
- Domestic vs. foreign ownership of debt
Using federal reserve system data and modern visualization tools, we can now create more sophisticated models that account for these multiple factors simultaneously, providing a more accurate picture of debt sustainability.
Unique Factors Affecting U.S. Debt Capacity
The United States occupies a unique position in the global economy that significantly affects its debt capacity. I've identified several key factors that allow America to sustain higher debt levels than many other nations.
U.S. Debt Capacity Enhancers
These interconnected factors contribute to America's exceptional borrowing capacity:
                    flowchart TD
                        A[U.S. Debt Capacity] --> B[Reserve Currency Status]
                        A --> C[Deep Financial Markets]
                        A --> D[Strong Economic Growth]
                        A --> E[National Wealth Beyond GDP]
                        B --> F[Global Demand for U.S. Treasuries]
                        C --> F
                        F --> G[Lower Borrowing Costs]
                        D --> G
                        G --> H[Enhanced Debt Sustainability]
                        E --> H
The Dollar's Reserve Currency Status
Perhaps the most significant advantage is the U.S. dollar's status as the world's primary reserve currency. This creates persistent global demand for U.S. Treasury securities, allowing the government to borrow at lower interest rates than would otherwise be possible.
GDP Multiple: A Different Perspective
The Carnegie data reveals that the U.S. has a GDP multiple of 4.3, compared to the global average of 6.1. This means that America's total national wealth (including all assets) is 4.3 times its annual GDP. While this might initially seem concerning, it actually reflects the efficiency of the U.S. economy rather than a weakness.
Countries with higher multiples often have overvalued asset markets or less productive economies. For instance, China's multiple of 8.2 partly reflects significant overvaluation in its real estate sector.
Interest Rates and Debt Sustainability
The relationship between interest rates and economic growth is crucial for debt sustainability:
When economic growth exceeds interest rates, as was often the case in the 2010s, debt can be sustained more easily because the economy grows faster than the debt burden. However, this relationship has become more challenging in recent years as interest rates have risen.
Beyond GDP, the U.S. possesses enormous national wealth in terms of real estate, natural resources, intellectual property, and financial assets. This wealth provides an additional buffer that enhances debt sustainability, though it's not directly captured in standard debt-to-GDP metrics.
Comparative Analysis: America vs. Other Major Economies
To truly understand America's debt position, I find it essential to compare it with other major economies. Each country offers valuable lessons about different approaches to debt management and their consequences.
Japan: Living with High Debt
Japan presents perhaps the most interesting case study in high debt sustainability. With a debt-to-GDP ratio exceeding 260% and a GDP multiple of 7.2, Japan has maintained fiscal stability despite debt levels that would theoretically be unsustainable.
Japan has managed this through several mechanisms:
- High domestic ownership of government debt (over 90%)
- Extremely low or negative interest rates
- Central bank purchases of government bonds
- High household savings rates
However, Japan has also experienced decades of economic stagnation, raising questions about whether high debt levels have contributed to this prolonged malaise.
China: Hidden Debt Concerns
China presents a contrasting case with its GDP multiple of 8.2—the highest among major economies. This high multiple reflects potential asset overvaluation, particularly in real estate, and significant off-balance-sheet liabilities at the local government level.
Despite having a lower official debt-to-GDP ratio than the U.S., China faces greater debt sustainability challenges due to:
- Lower per capita income and still-developing financial markets
- Extensive hidden debt in local government financing vehicles
- Significant corporate debt, much of it held by state-owned enterprises
- Capital controls that limit international investment options
Debt Composition Across Major Economies
The composition of debt varies significantly across countries:
European Models: Contrasting Approaches
European economies offer interesting contrasts in debt management approaches. Germany (6.0 GDP multiple) has traditionally emphasized fiscal discipline, while France (7.7 GDP multiple) has been more comfortable with higher debt levels to finance social programs and economic intervention.
The European experience highlights how cultural attitudes toward debt, as well as institutional arrangements like the European Central Bank and EU fiscal rules, shape debt sustainability. These different models provide valuable context for evaluating America's economic journey and current debt position.
Future Implications and Decision Points
Looking ahead, I see several critical implications of current debt trends for the United States and the global economy. The "$91 trillion problem" of global government debt will require difficult choices in the coming years.
U.S. Debt Trajectory Scenarios
Projecting the U.S. debt trajectory through 2030 reveals several possible scenarios, each with different implications for economic growth, social spending, and fiscal stability.
U.S. Debt-to-GDP Projections Through 2030
Different policy approaches lead to divergent debt trajectories:
These projections highlight the trade-offs policymakers face between debt reduction, economic growth, and social spending. The "Fiscal Restraint Scenario" shows that debt reduction is possible but may require politically difficult spending cuts or tax increases. The "Expanded Spending Scenario" illustrates how debt could approach the concerning 150-180% threshold if current trends continue.
Policy Decision Tree
Policymakers face a complex set of options when addressing debt concerns. Each path involves different trade-offs and consequences:
                    flowchart TD
                        A[Debt Policy Decisions] --> B{Primary Approach?}
                        B -->|Reduce Deficit| C[Fiscal Restraint]
                        B -->|Maintain Status Quo| D[Gradual Debt Increase]
                        B -->|Expand Spending| E[Accelerated Debt Growth]
                        C --> C1[Spending Cuts]
                        C --> C2[Tax Increases]
                        C --> C3[Combination Approach]
                        D --> D1[Focus on Growth]
                        D --> D2[Inflation Management]
                        E --> E1[Infrastructure Investment]
                        E --> E2[Social Program Expansion]
                        C1 --> F[Economic Contraction Risk]
                        C2 --> F
                        C3 --> G[Balanced Outcome]
                        D1 --> G
                        D2 --> H[Debt Service Burden]
                        E1 --> I[Long-term Growth Potential]
                        E2 --> H
The global debt challenge extends far beyond the United States. With governments worldwide owing an unprecedented $91 trillion, nearly equal to global GDP, difficult choices loom for many countries. These challenges will likely be exacerbated by rising interest rates, aging populations, and climate change adaptation costs.
As we look toward global economy 2025 projections, the management of these debt challenges will be a defining feature of economic policy worldwide. The decisions made in the next few years will have lasting implications for economic stability, growth potential, and intergenerational equity.
Visualizing Complex Economic Relationships
Understanding America's debt threshold requires visualizing complex, multidimensional relationships between economic variables. Traditional economic analysis often fails to capture these nuances, but modern visualization tools can help illuminate these connections.
Debt-to-Growth Correlations
The relationship between debt and economic growth is not linear but varies based on numerous factors. Visualizing this relationship helps identify potential tipping points.
Debt and Growth Relationship
This chart illustrates how economic growth tends to vary with different debt levels:
While there's a general negative correlation between high debt and growth, the relationship isn't uniform. Countries with strong institutions, reserve currency status, and deep financial markets (like the U.S.) can maintain higher growth at elevated debt levels than others.
Interconnected Debt Relationships
Government debt doesn't exist in isolation—it's interconnected with corporate and household debt. Understanding these relationships is crucial for assessing overall economic stability.
Debt Interconnections in the Economy
This diagram shows how different types of debt influence each other:
                    flowchart TD
                        A[Total Economic Debt] --> B[Government Debt]
                        A --> C[Corporate Debt]
                        A --> D[Household Debt]
                        A --> E[Financial Sector Debt]
                        B -.-> C
                        B -.-> D
                        C -.-> D
                        E -.-> B
                        E -.-> C
                        E -.-> D
                        B --> F[Fiscal Policy]
                        C --> G[Business Investment]
                        D --> H[Consumer Spending]
                        E --> I[Financial Stability]
                        F --> J[Economic Growth]
                        G --> J
                        H --> J
                        I --> J
                        J -.-> B
                        J -.-> C
                        J -.-> D
This interconnected nature of debt means that focusing solely on government debt provides an incomplete picture. For example, low government debt coupled with excessive private sector debt can still lead to economic instability, as seen in the 2008 financial crisis.
Historical Patterns and Future Projections
Examining historical patterns in debt and economic outcomes can provide valuable insights for future policy decisions. The wall street financial crises pattern recognition shows how debt accumulation has often preceded financial instability.

By visualizing how debt affects different sectors of the economy simultaneously, we can better understand the systemic risks and opportunities associated with various debt levels.
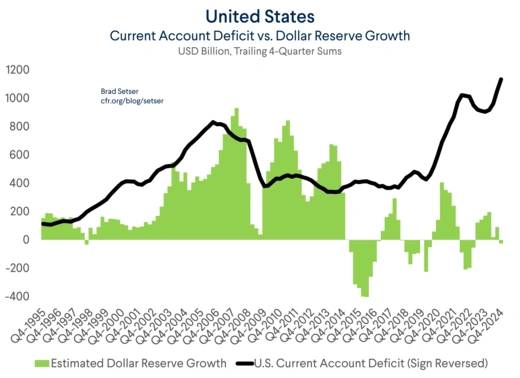
Understanding the us trade balance evolution also provides important context for America's debt position, as trade deficits contribute to external debt accumulation. These visualizations help policymakers and citizens alike grasp the complex interplay between debt, growth, and economic stability.
Transform Your Economic Data into Visual Insights
PageOn.ai makes complex economic relationships clear through powerful visualization tools. Whether you're analyzing debt sustainability, tracking economic indicators, or communicating fiscal policy options, our platform helps you create compelling visual expressions that drive understanding.
Start Creating with PageOn.ai TodayFinal Thoughts: Beyond Simple Thresholds
As I've explored throughout this analysis, the question "How much debt is too much for the world's largest economy?" defies simple answers. While economists once sought fixed thresholds like the 90% or 150-180% debt-to-GDP ratios, today's understanding is far more nuanced.
For the United States, debt sustainability depends on a complex interplay of factors including the dollar's reserve status, interest rates relative to growth, debt ownership patterns, and the overall health of the economy. The U.S. likely has more debt capacity than most other nations, but this capacity is not unlimited.
As debt levels continue to rise globally, visualizing these complex relationships becomes increasingly important. Modern visualization tools like those offered by PageOn.ai can help transform abstract economic concepts into accessible insights that inform better policy decisions and public understanding.
The coming years will test the limits of debt sustainability for many economies, including the United States. By leveraging advanced visualization techniques, we can better navigate these challenges and develop more effective approaches to managing debt in the world's largest economy.
You Might Also Like
The Meta-Mind Advantage: How Self-Aware AI Strategy Defines Market Leadership in 2025
Discover why metacognitive AI strategy separates industry leaders from followers in 2025. Learn frameworks for building self-aware AI implementation that drives competitive advantage.
Strategic AI Marketing Investment Roadmap: Maximizing ROI from the $360 Billion Surge | 2025 Marketing Tech Budget Guide
Navigate the $360 billion AI investment surge with strategic marketing technology budget allocation. Discover proven frameworks for maximizing ROI from AI marketing tools in 2025.
Mapping the Great Depression: Visualizing Economic Devastation and Recovery
Explore how data visualization transforms our understanding of the Great Depression, from unemployment heat maps to New Deal program impacts, bringing America's greatest economic crisis to life.
How 85% of Marketers Transform Content Strategy with AI Visual Tools | PageOn.ai
Discover how 85% of marketers are revolutionizing content strategy with AI tools, saving 3 hours per piece while improving quality and output by 82%.