Visualizing the Invisible: How to Transform Complex Biology Concepts into Visual Learning
Bridging the gap between abstract biological concepts and tangible understanding
In today's digital age, biology education faces unique challenges. Traditional teaching methods often overwhelm students with dense textual information when visual representations could make complex concepts clearer and more engaging. I'll guide you through effective strategies to transform abstract biological concepts into powerful visual learning experiences that enhance understanding and retention.
The Challenge of Biology Education in the Digital Age
Biology education faces a unique challenge: how do we make the invisible visible? As I've worked with students over the years, I've noticed that traditional biology teaching methods often create significant cognitive load, overwhelming students with complex terminology and processes they cannot directly observe.
The Text vs. Visual Gap
Most biology materials remain heavily text-based, yet research consistently shows that approximately 65% of people are visual learners. This mismatch creates a fundamental disconnect in how biology is taught versus how students best learn. Interactive visualizations for data exploration have proven particularly effective for bridging this gap.
Visual Learning Effectiveness
Studies show that students retain approximately 10% of what they read, but nearly 65% of visually presented information. When dealing with complex biological processes, this difference becomes even more pronounced. The evolution from static diagrams to interactive visual experiences represents a critical advancement in biology education.
Information Retention by Learning Method
The following chart compares retention rates across different learning modalities:
Visualization serves as a critical bridge between abstract biological concepts and tangible understanding. When students can see cellular processes or genetic mechanisms unfold before their eyes, these concepts transition from theoretical constructs to meaningful knowledge. This is especially important when teaching topics that operate at scales or timeframes outside normal human perception.
Core Biological Concepts That Demand Visual Transformation
Through my years of teaching biology, I've identified several concepts that consistently challenge students but respond remarkably well to visual transformation. These concepts often operate at scales or levels of complexity that make them difficult to comprehend through text alone.
Challenging Biology Topics
| Biological Concept | Visualization Challenge | Visual Solution |
|---|---|---|
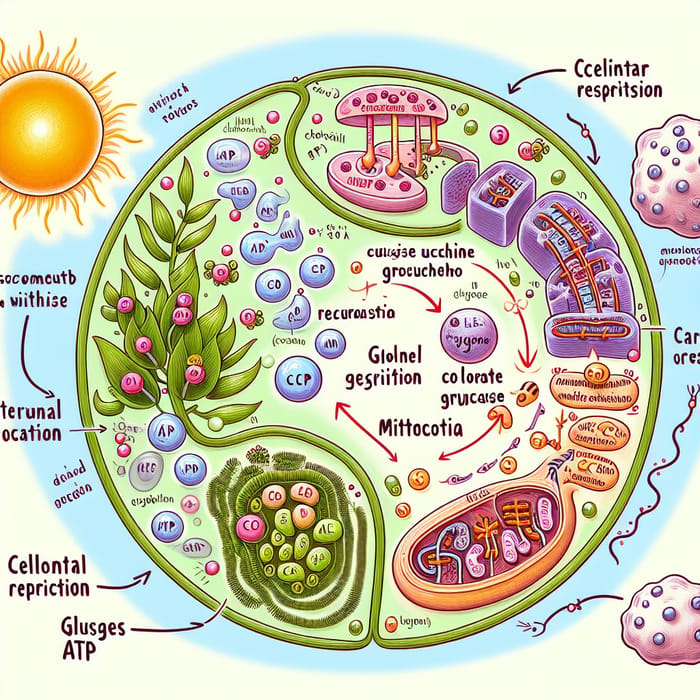
| Cellular Respiration | Multiple sequential steps across different cellular locations | Animated pathway with location transitions |
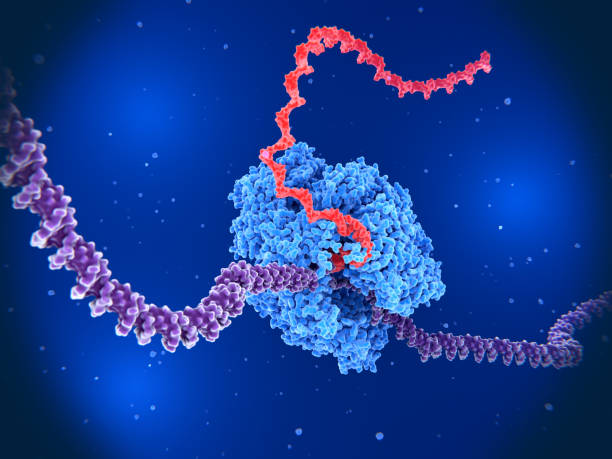
| DNA Replication | Molecular mechanisms operating at nanoscale | 3D models with enzyme action animations |
| Photosynthesis | Light-dependent and independent reactions | Split-screen visualizations with energy flow |
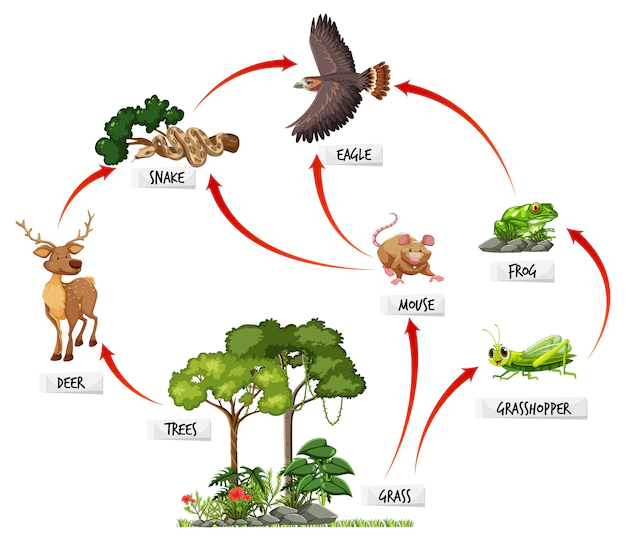
| Ecosystem Interactions | Complex multi-species relationships | Interactive food web with population dynamics |
| Protein Synthesis | Transcription and translation processes | Step-by-step animation with codon highlighting |
Educational research consistently identifies cellular processes and molecular mechanisms as the most challenging for students. These invisible processes operate at scales and timeframes that make them difficult to conceptualize without strong visual support. Biology research topics 2025 continue to emphasize the importance of visualization in understanding these complex systems.
Multi-dimensional concepts in biology—those that combine temporal, spatial, and functional dimensions—are particularly challenging for students. For example, understanding how a protein's three-dimensional structure determines its function, while also considering how that structure forms over time, requires sophisticated visual representation techniques that static textbooks simply cannot provide.
Visual Learning Frameworks for Biology Education
The cognitive science behind visual learning offers valuable insights for biology educators. When I design visual learning experiences, I rely on research-backed frameworks that optimize how students process and retain complex biological information.
Visual Learning Framework Progression
A structured approach to building visual complexity in biology education:
                    flowchart TD
                        A[Simple Iconic Representation] -->|Add Details| B[Basic Structural Model]
                        B -->|Add Functionality| C[Functional Representation]
                        C -->|Add Interactions| D[System Interaction Model]
                        D -->|Add Time Dimension| E[Dynamic Process Visualization]
                        E -->|Add Multiple Scales| F[Multi-scale Integration]
                        style A fill:#FFE0B2,stroke:#FF8000,color:#333
                        style B fill:#FFCC80,stroke:#FF8000,color:#333
                        style C fill:#FFB74D,stroke:#FF8000,color:#333
                        style D fill:#FFA726,stroke:#FF8000,color:#333
                        style E fill:#FF9800,stroke:#FF8000,color:#333
                        style F fill:#FF8000,stroke:#FF8000,color:#fff
Balancing Scientific Accuracy with Visual Accessibility
One of the greatest challenges in creating biology visualizations is finding the right balance between scientific accuracy and visual accessibility. Oversimplification can lead to misconceptions, while excessive detail can overwhelm learners. I've found that a progressive approach works best—starting with simplified models that establish core concepts before introducing more detailed representations.
Interactive vs. Static Visualizations
While static visualizations have their place in biology education, data visualization techniques have evolved to include interactive elements that significantly enhance learning. Interactive visualizations allow students to manipulate variables, zoom across different scales, and observe cause-effect relationships in real-time.
Visual Narratives in Biology
Creating visual narratives that follow biological processes chronologically helps students understand the sequential nature of many biological mechanisms. For example, visualizing the step-by-step process of cellular respiration as a journey from glucose to ATP production creates a compelling story that enhances retention.
Effectiveness of Different Visualization Types
Comparison of learning outcomes across different visualization approaches:
The cognitive science literature clearly demonstrates that well-designed visualizations reduce cognitive load by offloading mental processing to the visual system. This is particularly valuable in biology, where students must often hold multiple complex concepts in mind simultaneously to understand system-level interactions.
Transforming Cellular Biology Through Visual Storytelling
Cellular biology presents unique visualization challenges because it involves processes that occur at microscopic scales and often involve complex sequences of events. In my experience, breaking down these processes into visual sequences dramatically improves student comprehension.

Visualizing Scale in Biology
One of the most challenging aspects of cellular biology is helping students understand the vast differences in scale—from molecules to cells to tissues to organisms. I've found that interactive zoom visualizations that allow students to move between these different scales create powerful "aha" moments. Science slides with AI tools can help create these multi-scale visualizations efficiently.
Cellular Respiration Visual Breakdown
A sequential visual representation of the cellular respiration process:
                    flowchart LR
                        subgraph Cytoplasm
                            A[Glucose] -->|Glycolysis| B[Pyruvate]
                            B -->|+ NAD+| C[NADH]
                            B -->|+ ADP| D[ATP]
                        end
                        subgraph Mitochondrion
                            B -->|Transport| E[Acetyl-CoA]
                            E -->|Krebs Cycle| F[NADH/FADH2]
                            F -->|ETC| G[Proton Gradient]
                            G -->|ATP Synthase| H[ATP]
                        end
                        style A fill:#FFE0B2,stroke:#FF8000
                        style B fill:#FFCC80,stroke:#FF8000
                        style C fill:#FFB74D,stroke:#FF8000
                        style D fill:#FFA726,stroke:#FF8000
                        style E fill:#FF9800,stroke:#FF8000
                        style F fill:#FB8C00,stroke:#FF8000
                        style G fill:#F57C00,stroke:#FF8000
                        style H fill:#EF6C00,stroke:#FF8000,color:#fff
                        style Cytoplasm fill:#E3F2FD,stroke:#90CAF9
                        style Mitochondrion fill:#FFECB3,stroke:#FFD54F
Color-Coding and Visual Language
Consistent color-coding and visual language are essential for effective biology visualizations. When I develop visual materials, I establish a clear visual language where:
- Each organelle maintains a consistent color scheme across all visualizations
- Molecular components (ATP, enzymes, substrates) have distinct visual identities
- Energy states are represented through consistent color gradients (e.g., high-energy molecules in warm colors)
- Direction of processes is indicated through consistent arrow styles
- Scale is indicated through relative sizing and contextual cues
Creating visual transitions between micro and macro biological systems helps students connect cellular processes to their larger biological context. For example, showing how individual muscle cell metabolism scales up to whole-body energy use during exercise creates meaningful connections between different levels of biological organization.
Genetic Concepts Reimagined Visually
Genetics presents some of the most abstract concepts in biology. The invisible nature of DNA, genes, and molecular mechanisms of inheritance requires thoughtful visualization approaches to make these concepts tangible for students.
Student Understanding of Genetic Concepts
Comparison of student comprehension with and without visual learning tools:
DNA and Protein Synthesis Visualization
Creating clear visual distinctions between genotype and phenotype helps students understand the relationship between genetic information and observable traits. I've found that using consistent color schemes and visual metaphors helps students track the flow of genetic information from DNA to functional proteins.
Animated approaches to complex genetic mechanisms like epigenetics are particularly effective. By visualizing how methyl groups attach to DNA and affect gene expression, students can grasp these abstract concepts more concretely. Biology lesson plans for high school can benefit greatly from these visual approaches to genetics.
Using PageOn.ai's AI Blocks feature has transformed how I teach genetic concepts. This tool allows me to build progressive genetic concept maps that show relationships between genes, proteins, and phenotypic traits. Students can interact with these maps, exploring different genetic combinations and their outcomes, which is particularly valuable for teaching complex inheritance patterns.
Protein Synthesis Visualization
The central dogma of molecular biology visualized:
                    flowchart LR
                        A[DNA] -->|Transcription| B[mRNA]
                        B -->|Translation| C[Protein]
                        D[RNA Polymerase] -.->|Facilitates| A
                        E[Ribosome] -.->|Facilitates| B
                        F[tRNA] -.->|Assists| E
                        style A fill:#FFE0B2,stroke:#FF8000
                        style B fill:#FFCC80,stroke:#FF8000
                        style C fill:#FF8000,stroke:#FF8000,color:#fff
                        style D fill:#E3F2FD,stroke:#90CAF9
                        style E fill:#E8F5E9,stroke:#A5D6A7
                        style F fill:#F3E5F5,stroke:#CE93D8
Representing genetic variation and inheritance patterns visually helps students understand complex concepts like incomplete dominance, codominance, and polygenic inheritance. Interactive Punnett squares and pedigree diagrams allow students to explore different inheritance scenarios and predict outcomes.
Ecosystem Dynamics and Visual Learning
Ecosystems involve complex interactions between organisms and their environment. Visualizing these interactions helps students understand the interconnected nature of ecological systems and the consequences of disruptions.
Food Webs and Energy Flow
Traditional static food web diagrams often fail to capture the dynamic nature of ecosystem interactions. I've found that transforming these into interactive visualizations where students can track energy flow or remove species to observe cascading effects creates much deeper understanding of ecosystem dynamics.
Temporal Changes in Ecosystems
Representing temporal changes in ecosystems through visual progression helps students understand ecological succession, seasonal changes, and long-term environmental impacts. Time-lapse visualizations that compress years of ecosystem development into minutes create powerful learning experiences.
Nutrient Cycle Visualization
The nitrogen cycle in a terrestrial ecosystem:
                    flowchart TD
                        A[Atmospheric N₂] -->|Nitrogen Fixation| B[NH₃/NH₄⁺]
                        B -->|Nitrification| C[NO₂⁻]
                        C -->|Nitrification| D[NO₃⁻]
                        D -->|Plant Uptake| E[Organic N in Plants]
                        E -->|Consumption| F[Organic N in Animals]
                        E -->|Death/Decay| G[Organic N in Soil]
                        F -->|Death/Excretion| G
                        G -->|Ammonification| B
                        D -->|Denitrification| A
                        style A fill:#E3F2FD,stroke:#90CAF9
                        style B fill:#BBDEFB,stroke:#90CAF9
                        style C fill:#90CAF9,stroke:#64B5F6
                        style D fill:#64B5F6,stroke:#42A5F5
                        style E fill:#A5D6A7,stroke:#81C784
                        style F fill:#FFD54F,stroke:#FFCA28
                        style G fill:#8D6E63,stroke:#795548
Visualizing invisible ecosystem factors such as nutrient cycles and chemical processes makes these abstract concepts more concrete for students. For example, using color gradients to represent nitrogen concentration in different ecosystem components helps students track this essential nutrient through its cycle.
PageOn.ai's Deep Search feature has been invaluable for incorporating real-world ecosystem imagery and data into my visualizations. This tool allows me to quickly find relevant images, graphs, and datasets that illustrate ecosystem principles, making abstract concepts more concrete and relatable for students.
Implementation Strategies for Educators
Transforming text-heavy biology lessons into visual content requires a systematic approach. I've developed a step-by-step methodology that helps educators make this transition effectively.
Step-by-Step Transformation Process
- Content Analysis: Identify the core concepts and relationships in your lesson
- Visual Mapping: Determine which visualization types best suit each concept
- Storyboarding: Create a visual sequence that builds understanding progressively
- Visual Asset Creation: Develop or source appropriate visual elements
- Integration: Combine visuals with concise explanatory text
- Assessment Alignment: Develop visual-based assessment methods
- Implementation: Deliver the visual lesson with appropriate scaffolding
- Feedback Collection: Gather student feedback on visual effectiveness
- Iteration: Refine visuals based on learning outcomes and feedback
Assessment Techniques
Traditional text-based assessments often fail to measure visual learning effectively. I've found that incorporating visual assessment techniques—such as having students create their own visual explanations, identify errors in provided visualizations, or predict outcomes based on visual scenarios—provides more accurate measurement of conceptual understanding.
Balancing Visual Learning
While visual learning is powerful, it's important to balance it with other educational modalities. I've found that a multimodal approach—combining visual, textual, auditory, and kinesthetic elements—creates the most robust learning experiences. This approach accommodates diverse learning preferences while reinforcing concepts through multiple channels.
Addressing Different Learning Styles
Visual diversity is essential for addressing different learning preferences. Some students respond better to schematic diagrams, others to realistic illustrations, and still others to data visualizations. Incorporating multiple visual approaches ensures that all students can access the content effectively.

PageOn.ai's Vibe Creation feature has revolutionized how quickly I can generate biology visualizations from complex concepts. This tool allows me to input a biological concept and receive multiple visualization options that I can refine and customize to meet my specific teaching needs. This efficiency has allowed me to incorporate more visual elements into my teaching without significantly increasing preparation time.
Case Studies: Visual Transformation Success Stories
The impact of visual learning in biology education is best illustrated through real-world examples. I've collected several case studies that demonstrate the transformative power of visual approaches.
High School AP Biology Performance Improvement
A high school in California transformed their AP Biology curriculum to emphasize visual learning approaches. They created interactive visualizations for the most challenging topics—cellular respiration, photosynthesis, and gene regulation—and implemented them consistently throughout the course.
AP Biology Exam Results
The results were remarkable: AP Biology scores increased from a school average of 3.0 to 4.2 over three years, significantly outpacing the national average. More importantly, student surveys indicated greater confidence in understanding complex biological processes and higher engagement with the material.
University-Level Complex Topic Mastery
A university biology department redesigned their molecular biology course to incorporate extensive visual learning elements. They created a series of interactive simulations that allowed students to manipulate molecular structures and observe the effects on function.
The department tracked performance on their comprehensive final exam, which included both visual and traditional assessment components. Students in the visually-enhanced course scored an average of 24% higher on conceptual questions compared to previous cohorts, with particularly strong improvements among students who had previously struggled with abstract concepts.
Student Engagement Metrics
Across multiple case studies, student engagement metrics consistently improved with the implementation of visual learning approaches. Attendance rates, participation in discussions, and time spent on learning materials all increased significantly when visual elements were incorporated effectively.
Feedback analysis from diverse student populations has revealed that visual learning approaches are particularly beneficial for:
- English language learners, who can access content with reduced language barriers
- Students with attention difficulties, who find visual content more engaging
- Students with limited prior knowledge in biology, who can build foundational understanding more quickly
- Advanced students, who can explore complex relationships more deeply through interactive visualizations
PageOn.ai has played a crucial role in these success stories by helping educators transform abstract concepts into clear visual narratives. The platform's intuitive tools and AI-powered suggestions have made it possible for teachers with limited design experience to create professional-quality visualizations that effectively communicate complex biological concepts.
Future of Visual Biology Education
The landscape of visual biology education is evolving rapidly, with emerging technologies opening new possibilities for immersive and interactive learning experiences.
Emerging Visualization Technologies
Augmented Reality (AR)
AR applications allow students to overlay biological structures and processes onto their real environment. Imagine pointing a tablet at a desk and seeing a 3D cell appear, with the ability to peel away layers and observe internal processes in real-time.
Virtual Reality (VR)
VR creates fully immersive experiences where students can "enter" a cell or ecosystem. These experiences create powerful spatial memories and allow for exploration of environments that would be impossible to visit physically, such as the interior of a mitochondrion.
Interactive Simulations
Advanced simulations allow students to manipulate variables and observe system-wide effects. These tools help students develop intuition for complex biological systems by allowing them to test hypotheses and observe outcomes in real-time.

Real-Time Data Visualization
The integration of real-time data visualization in biology education is creating powerful connections between classroom learning and current research. Students can access and visualize data from ongoing experiments, environmental monitoring stations, or genomic databases, bringing biology to life as an active, evolving science rather than a static body of knowledge.
Personalized Visual Learning
Advances in adaptive learning technologies are making it possible to create personalized visual learning paths based on student comprehension. These systems can detect when a student is struggling with a particular concept and provide alternative visualizations or additional scaffolding to support understanding.
Evolution of Biology Visualization
The progression of visualization approaches in biology education:
                    flowchart LR
                        A[Static Textbook Images] --> B[Interactive 2D Visualizations]
                        B --> C[3D Digital Models]
                        C --> D[AR/VR Immersive Experiences]
                        D --> E[AI-Generated Adaptive Visualizations]
                        E --> F[Neural Interface Direct Visualization]
                        style A fill:#FFE0B2,stroke:#FF8000
                        style B fill:#FFCC80,stroke:#FF8000
                        style C fill:#FFB74D,stroke:#FF8000
                        style D fill:#FFA726,stroke:#FF8000
                        style E fill:#FF9800,stroke:#FF8000
                        style F fill:#F57C00,stroke:#FF8000,color:#fff
Collaborative Visual Learning
Collaborative visual learning environments allow students to work together on complex biological problems, each contributing to a shared visualization. These environments foster peer learning and help students develop communication skills around scientific concepts.
PageOn.ai's agentic capabilities are pioneering next-generation biology visualizations by using AI to interpret complex biological information and generate appropriate visualizations automatically. This technology can analyze a biology textbook chapter or research paper and create customized visual representations that highlight key concepts and relationships, making sophisticated content more accessible to students at all levels.
Resources and Implementation Guide
Implementing visual learning approaches in biology education requires the right tools, strategies, and resources. Here's a comprehensive guide to help you get started.
Creating Your First Biology Visual Learning Module
- Select a challenging topic that students typically struggle to understand
- Identify the key concepts and relationships within that topic
- Determine the appropriate visual approach (static diagram, animation, interactive simulation)
- Create a storyboard outlining the visual progression
- Develop or source visual assets using recommended tools
- Add concise explanatory text to support the visuals
- Include interactive elements where appropriate
- Create assessment activities aligned with the visual approach
- Test with a small group of students and gather feedback
- Refine based on feedback before full implementation
Recommended Tools and Platforms
| Tool Category | Recommended Options | Best For |
|---|---|---|
| 3D Molecular Visualization | UCSF Chimera, PyMOL, Jmol | Protein structures, molecular interactions |
| Interactive Diagrams | BioRender, PageOn.ai, Lucidchart | Cellular processes, pathways, mechanisms |
| Data Visualization | Tableau, R with ggplot2, Python with Plotly | Experimental data, population trends |
| AR/VR Biology | Merge Cube, InCell VR, Anatomy 4D | Immersive exploration of structures |
| Simulation Software | NetLogo, SimBio, Foldit | Ecosystem dynamics, evolution, protein folding |
Assessment Templates
Traditional assessments often fail to measure the benefits of visual learning. Consider these alternative assessment approaches:
- Visual Explanation Tasks: Have students create their own visual explanations of biological processes
- Error Detection: Present students with visualizations containing deliberate errors and ask them to identify and correct them
- Prediction Challenges: Show part of a process and ask students to predict subsequent steps or outcomes
- Visual-to-Text Translation: Ask students to provide written explanations of visual representations
- Comparative Analysis: Have students compare different visual representations of the same biological concept
Community Resources
Connect with other biology educators embracing visual teaching methods through these communities:
- The National Association of Biology Teachers (NABT) Visual Learning Community
- BioVis: The Biological Data Visualization Community
- HHMI BioInteractive Educator Community
- Social media groups focused on biology education innovation
- University biology education research groups
Quick-Start Guide to Using PageOn.ai
PageOn.ai offers powerful tools specifically designed for transforming complex biology topics into visual learning experiences:
- Start with Vibe Creation: Input your biology topic and receive AI-generated visualization suggestions
- Refine with AI Blocks: Build modular visual explanations of complex processes
- Enhance with Deep Search: Find relevant images and data to incorporate into your visualizations
- Create interactive elements: Add clickable components to reveal additional information
- Export in multiple formats: Generate materials for different learning contexts
With these resources and implementation strategies, you're well-equipped to begin transforming your biology teaching through visual learning approaches. Start small with a single challenging topic, measure the impact, and gradually expand your visual teaching repertoire as you gain confidence and expertise.
Transform Your Biology Teaching with PageOn.ai
Ready to revolutionize how your students understand complex biology concepts? PageOn.ai's powerful visualization tools make it easy to create engaging, interactive visual learning experiences—no design expertise required.
Start Creating with PageOn.ai TodayFinal Thoughts
The transformation of complex biology topics into visual learning experiences represents one of the most significant opportunities to improve science education today. By leveraging the power of visualization, we can make abstract concepts tangible, complex systems understandable, and invisible processes visible.
As we've explored throughout this guide, effective visual learning in biology isn't simply about creating pretty pictures—it's about thoughtfully designing visual experiences that reduce cognitive load, highlight key relationships, and create memorable learning moments. The cognitive science is clear: when implemented effectively, visual learning approaches significantly enhance understanding and retention of biological concepts.
With tools like PageOn.ai making sophisticated visualization more accessible than ever before, there's never been a better time to incorporate visual learning approaches into your biology teaching. Whether you're a high school teacher looking to improve student engagement or a university professor aiming to enhance understanding of complex molecular mechanisms, visual transformation can help you achieve your educational goals more effectively.
You Might Also Like
From Complexity to Clarity: Why Creators Are Trading Notion for Apple Notes
Discover why creators are simplifying their productivity systems by moving from Notion to Apple Notes, and how this digital minimalism enhances creative output and mental clarity.
Strategic Infographic Planning: Transform Complex Ideas into Visual Narratives | PageOn.ai
Master strategic content planning for infographics that tell clear visual stories. Learn frameworks, data visualization strategies, and design elements that transform complex ideas into engaging narratives.
AI-Powered Coding Assistants: Integrating Language Models into Development Workflows
Discover how AI coding assistants transform development workflows by integrating language models to create visual clarity in complex programming environments.
Transforming Legal Reasoning: Visual Approaches to Modern Jurisprudence | PageOn.ai
Discover how visual approaches are revolutionizing legal reasoning in modern jurisprudence. Learn practical tools, methodologies, and technological innovations for enhanced legal analysis.