Visualizing Workplace Structure: The Ultimate Guide to Modern Organization Maps
Transform static hierarchies into dynamic visual representations
I've spent years helping organizations move beyond traditional org charts to create meaningful visual maps that truly represent how modern companies function. In this guide, I'll share everything I've learned about transforming employee hierarchies into powerful visual tools.
Understanding Organization Maps in Today's Workplace
I've witnessed a remarkable evolution in how organizations visualize their structure over the past decade. The transition from static hierarchical charts to dynamic organizational mapping represents a fundamental shift in how we think about workplace relationships.

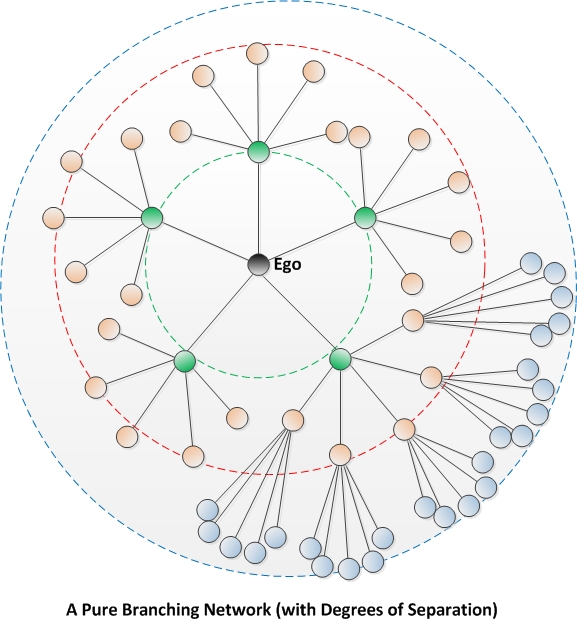
From Hierarchy to Network
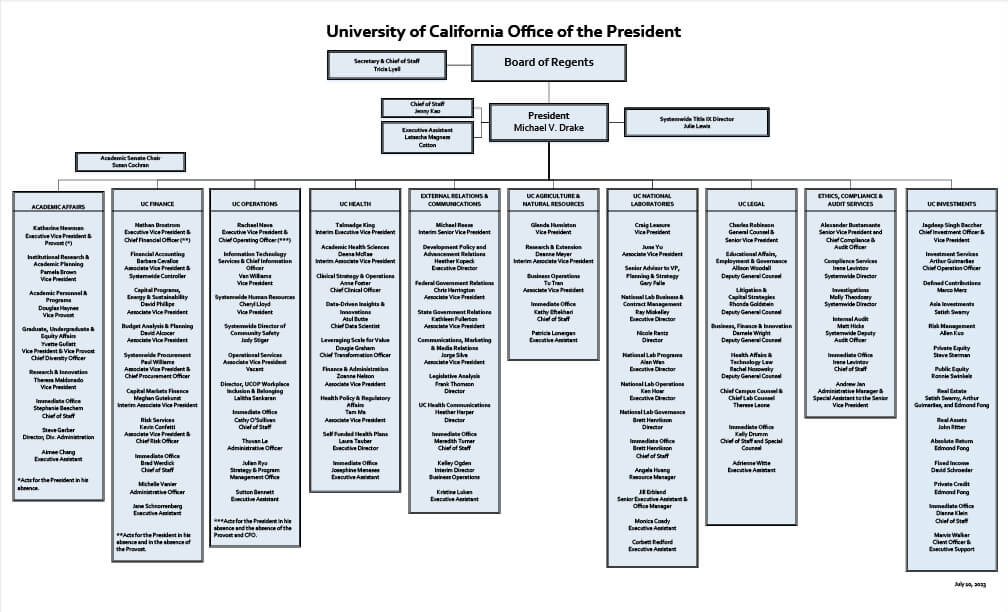
Traditional org charts served their purpose for decades, but they fundamentally misrepresent how modern organizations actually function. I've found that the key differences between old-school hierarchical charts and today's visual organization maps include:
- Traditional charts show formal reporting relationships; modern maps reveal actual work patterns
- Static PDFs vs. interactive digital tools that update in real-time
- Rigid top-down structures vs. fluid network representations
- Limited information (name, title) vs. rich context (skills, projects, influence)
The Psychology of Visual Structure
There's fascinating psychology behind how we interpret workplace structures visually. When I create team dynamics mapping, I'm always mindful of how visual hierarchies affect perception of authority, how proximity suggests collaboration frequency, and how visual prominence influences perceived importance.
Pain Points in Organizational Visualization
My research with organizations reveals these common challenges:
Modern businesses need fluid, accessible organizational visualization tools because today's workplace is characterized by rapid change, cross-functional collaboration, and distributed teams. In my experience working with organizations of all sizes, those that embrace dynamic organization mapping gain significant advantages in onboarding speed, collaboration efficiency, and overall organizational clarity.
The Components of Effective Organization Maps
Through my work helping companies visualize their structures, I've identified several essential elements that every effective organization map should include. Let me walk you through these components and how they work together.
Essential Elements
| Element | Purpose | Implementation |
|---|---|---|
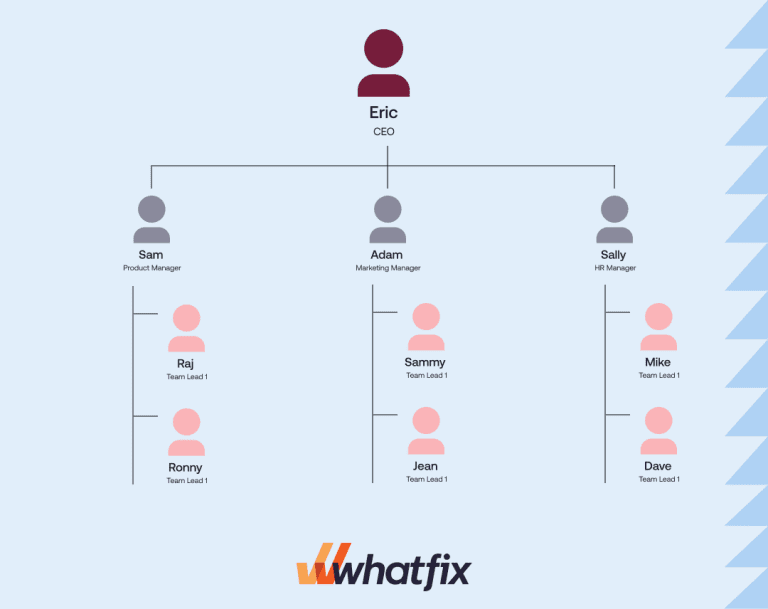
| Person Nodes | Represent individual team members | Include photo, name, title, and key skills |
| Relationship Lines | Show reporting and collaborative relationships | Use different line styles for different relationship types |
| Team Groupings | Organize people into functional units | Color-coded containers with clear labels |
| Skill Indicators | Highlight expertise and capabilities | Icons or tags associated with each person |
| Project Overlays | Show temporary cross-functional teams | Toggleable layers that highlight project teams |
Balancing Formal and Informal Structures
One of the biggest challenges I face when creating organization maps is balancing formal reporting relationships with informal influence networks. The most effective maps I've designed include both, using visual differentiation to distinguish between:
                    flowchart TD
                        CEO[CEO] --> COO[COO]
                        CEO --> CTO[CTO]
                        CEO --> CMO[CMO]
                        COO --> Dir1[Director of Ops]
                        COO --> Dir2[Director of HR]
                        CTO --> TL1[Team Lead 1]
                        CTO --> TL2[Team Lead 2]
                        CMO --> MM1[Marketing Manager]
                        %% Informal influence lines
                        TL1 -.-> MM1
                        Dir1 -.-> TL2
                        classDef standard fill:#FF8000,stroke:#333,stroke-width:1px;
                        classDef informal fill:#FFF,stroke:#FF8000,stroke-width:1px,stroke-dasharray: 5 5;
                        class CEO,COO,CTO,CMO,Dir1,Dir2,TL1,TL2,MM1 standard;
Solid lines represent formal reporting relationships, while dotted lines show informal influence paths.
Color-Coding and Visual Cues
I've found that thoughtful use of color-coding and visual cues dramatically enhances comprehension of organizational chart online tools. When I design organization maps, I typically use:
Color Application
- Department-based color coding
- Intensity variations to show seniority
- Contrasting colors for different locations
- Neutral backgrounds with vibrant highlights
Visual Indicators
- Icons for special roles or responsibilities
- Size variations to indicate team size
- Border styles to show employment type
- Badges for skills and certifications
Accessibility Considerations
In my experience, accessibility is often overlooked in organization mapping. I always ensure my maps are accessible across different platforms by using colorblind-friendly palettes, providing text alternatives for visual elements, ensuring keyboard navigability for interactive elements, and designing responsive layouts that work on various screen sizes.
Beyond the Hierarchy: Advanced Organization Mapping Techniques
After mastering the basics, I've found that the most insightful organization maps go beyond simple hierarchies to reveal deeper organizational dynamics. Let me share some advanced techniques I use to create truly valuable visualizations.
Revealing Hidden Power Structures
One of the most valuable aspects of modern organization mapping is the ability to reveal hidden power structures that don't appear on traditional charts. I've developed techniques to visualize these informal influence networks by:
- Conducting network analysis of communication patterns
- Mapping decision-making flows across projects
- Identifying knowledge brokers who connect different teams
- Visualizing mentorship and guidance relationships
These techniques have proven especially valuable when I work with companies undergoing reorganization, as they help preserve important informal networks that might otherwise be disrupted.
Mapping Skill Clusters
Visualizing skill distribution across an organization reveals valuable insights:
When I map skill clusters across organizations, I often discover surprising patterns of expertise distribution. This approach helps identify potential skill gaps, opportunities for cross-training, and hidden expertise that might be leveraged for new initiatives.
Visualizing Communication Pathways
                    flowchart LR
                        subgraph ENG[Engineering]
                            E1[Team Lead]
                            E2[Developer 1]
                            E3[Developer 2]
                        end
                        subgraph PM[Product]
                            P1[Product Manager]
                            P2[UX Designer]
                        end
                        subgraph MKT[Marketing]
                            M1[Marketing Director]
                            M2[Content Creator]
                        end
                        E1 --> P1
                        P1 --> M1
                        E1 --> M1
                        P2 --> E2
                        P2 --> E3
                        M2 --> P2
                        classDef engineering fill:#FF8000,color:white;
                        classDef product fill:#42A5F5,color:white;
                        classDef marketing fill:#66BB6A,color:white;
                        class E1,E2,E3 engineering;
                        class P1,P2 product;
                        class M1,M2 marketing;
Communication flow visualization showing cross-departmental interactions.
Understanding how information flows through an organization is critical for improving collaboration and reducing silos. I've developed specific techniques for mapping communication pathways that reveal bottlenecks, isolated teams, and key information brokers.
Integrating Project-Based Structures
Modern organizations often operate with a mix of permanent hierarchies and temporary project teams. I've pioneered approaches to visualize this complexity using:

Using PageOn.ai's AI Blocks feature, I can create layered views of organizational relationships that show how the same people might have different roles and reporting relationships in different contexts. This has been particularly valuable for matrix organizations and companies with frequent project-based work.
These advanced techniques go well beyond traditional org charts, creating AI-powered organizational chart visualizations that truly reflect how modern organizations function. By revealing both formal and informal structures, they provide insights that drive better collaboration, more effective communication, and stronger organizational design.
Creating Your Organization Map with AI Technology
After years of struggling with traditional org chart software, I've embraced AI-powered solutions that make creating and maintaining organization maps dramatically easier. Let me walk you through how these new technologies are transforming the process.
Limitations of Traditional Solutions
Traditional org chart software falls short in several key areas:
AI-Powered Transformation
The emergence of AI-powered organizational chart tools has fundamentally changed how I approach organization mapping. These tools transform static hierarchies into living documents through:

AI-Powered Organization Mapping Process
                    flowchart TD
                        A[Input Data Sources] --> B[AI Processing]
                        B --> C[Initial Map Generation]
                        C --> D[User Refinement]
                        D --> E[AI Enhancement]
                        E --> F[Final Organization Map]
                        subgraph "Input Options"
                            A1[Spreadsheet Upload]
                            A2[Natural Language]
                            A3[HR System Integration]
                        end
                        subgraph "AI Enhancement"
                            E1[Relationship Inference]
                            E2[Skill Detection]
                            E3[Pattern Recognition]
                        end
                        A1 --> A
                        A2 --> A
                        A3 --> A
                        E --> E1
                        E --> E2
                        E --> E3
                        classDef orange fill:#FF8000,color:white;
                        classDef blue fill:#42A5F5,color:white;
                        class A,B,C,D,E,F orange;
                        class A1,A2,A3,E1,E2,E3 blue;
Voice-to-Visual Capabilities
One of my favorite features of PageOn.ai is the ability to dictate organizational changes using natural language. I can simply say, "Move Jane from Marketing to the Product team and have her report to Michael," and the AI automatically updates the visualization. This dramatically speeds up the process of keeping maps current and reduces the friction that often leads to outdated charts.
Leveraging Deep Search for Data Integration
When I work with larger organizations, manually entering employee data would be prohibitively time-consuming. PageOn.ai's Deep Search capability automatically incorporates:
- Employee profile information and photos from connected systems
- Skills and expertise data from HR databases
- Project assignments and team memberships
- Location and contact details
This automated data integration ensures that organization maps remain comprehensive and current with minimal manual effort.
Real-Time Collaboration
Modern organization mapping requires input from multiple stakeholders across the company. I've found that PageOn.ai's real-time collaboration features make this process much more efficient, allowing team members to:
Collaborative Features
- Simultaneously edit the same organization map
- Comment on specific elements or relationships
- Suggest changes for approval by map owners
- Track revision history and compare versions
Benefits
- Faster map creation and updates
- More accurate representation of actual structure
- Greater buy-in from all departments
- Continuous refinement rather than point-in-time updates
Implementation Strategies for Different Organization Types
I've helped organizations of all sizes implement visual organization mapping, and I've found that the approach needs to be tailored to the specific characteristics of each organization type. Let me share the strategies that have proven most effective.
Small Business Approaches
For small businesses and startups, I recommend focusing on flexibility and growth planning in organization maps. Key strategies include:
- Emphasizing roles and responsibilities over rigid hierarchies
- Including skill visualization to identify coverage and gaps
- Creating "future state" views to plan for growth
- Highlighting external partnerships and resources
I've found that small businesses benefit most from organization maps that acknowledge the reality of people wearing multiple hats while also creating clarity around decision-making authority.
Enterprise-Scale Solutions
                    flowchart TD
                        CEO[CEO] --> C1[C-Suite]
                        C1 --> D1[Division Heads]
                        D1 --> R1[Regional Leaders]
                        R1 --> F1[Functional Leaders]
                        F1 --> T1[Team Leads]
                        T1 --> I1[Individual Contributors]
                        subgraph "Layered Views"
                            L1[Executive View]
                            L2[Division View]
                            L3[Department View]
                            L4[Team View]
                        end
                        L1 --> CEO
                        L1 --> C1
                        L2 --> D1
                        L2 --> R1
                        L3 --> F1
                        L4 --> T1
                        L4 --> I1
                        classDef main fill:#FF8000,color:white;
                        classDef layers fill:#42A5F5,color:white;
                        class CEO,C1,D1,R1,F1,T1,I1 main;
                        class L1,L2,L3,L4 layers;
Enterprise organization mapping requires multiple interconnected layers of visualization.
When I work with large enterprises, the key challenge is managing complexity while maintaining usability. My approach typically includes:
- Creating interconnected but distinct maps for different organizational levels
- Implementing role-based views that show relevant information to different users
- Automating data synchronization with HR systems
- Developing governance processes for maintaining accuracy
Nonprofit and Volunteer Organizations
Nonprofits present unique challenges due to their mix of paid staff, volunteers, board members, and committees. When I create organization maps for these organizations, I focus on:
Governance Structure
- Board of Directors relationships
- Committee structures and membership
- Advisory group connections
- Clear delineation of oversight vs. operations
Volunteer Integration
- Volunteer team structures
- Staff-volunteer coordination paths
- Time commitment indicators
- Skill-based volunteer assignment
Remote and Distributed Teams
With the rise of remote work, I've developed specialized approaches for mapping distributed organizations. These focus on:
- Incorporating time zone and location information
- Highlighting communication channels and preferred contact methods
- Visualizing work hour overlaps between team members
- Including virtual team structures and collaboration hubs
Regardless of organization type, I've found that PageOn.ai adapts exceptionally well through its conversational creation approach. Users can simply describe their organization's unique characteristics, and the AI generates appropriate visualization structures that can then be refined through further conversation.
Case Studies: Organization Maps in Action
I've had the privilege of helping organizations across various industries implement visual organization mapping. These case studies highlight real-world applications and outcomes.
Tech Startup Growth Mapping
I worked with a rapidly growing SaaS startup that expanded from 15 to 150 employees in just 18 months. Their challenges included:
- Maintaining their collaborative culture while adding management layers
- Ensuring new hires understood how the organization functioned
- Preserving cross-functional collaboration as teams specialized
- Planning future organizational states to support growth
We implemented a fluid organization mapping approach using PageOn.ai that allowed them to:
- Create "current state" and "3-month plan" views that helped everyone understand the evolution
- Visualize both formal reporting and cross-functional project teams
- Highlight skill clusters to identify knowledge transfer needs
- Update maps in real-time during weekly leadership meetings
The result was a 43% improvement in new hire onboarding time and significantly higher scores on "organizational clarity" in employee surveys.
Healthcare System Implementation
Outcomes from implementing cross-functional team mapping in a regional healthcare system:
A regional healthcare system with 3,000+ employees across multiple facilities struggled with cross-functional coordination between departments. Their traditional org chart showed reporting relationships but failed to capture how patient care teams actually worked together.
We implemented a multi-layered organization mapping approach that:
- Visualized both departmental structures and patient care pathways
- Highlighted key coordination points between departments
- Mapped communication protocols for different scenarios
- Identified potential bottlenecks in patient handoffs
The new visualization approach significantly reduced patient handoff errors and improved cross-departmental collaboration scores in staff surveys.
Educational Institution Restructuring
When a mid-sized university undertook a major academic restructuring, they needed a way to visualize both current and future states while gathering input from faculty and staff. We created a dynamic mapping process that:
- Allowed stakeholders to see multiple reorganization scenarios
- Visualized impacts on interdisciplinary programs and research centers
- Highlighted changes in reporting relationships and resource allocation
- Facilitated collaborative refinement of the proposed structure
The interactive maps became central to town hall discussions and significantly increased buy-in for the reorganization by making impacts transparent and allowing for meaningful input.
Digital Organization for Independent Contractors
Even solo practitioners and small collectives benefit from organization mapping. I helped a network of independent creative professionals implement digital organization systems that:
                    flowchart TD
                        C[Freelance Collective] --> S1[Strategy Team]
                        C --> C1[Creative Team]
                        C --> T1[Technical Team]
                        subgraph "Project Teams"
                            P1[Project Alpha]
                            P2[Project Beta]
                            P3[Project Gamma]
                        end
                        S1 -.-> P1
                        S1 -.-> P3
                        C1 -.-> P1
                        C1 -.-> P2
                        C1 -.-> P3
                        T1 -.-> P2
                        T1 -.-> P3
                        classDef teams fill:#FF8000,color:white;
                        classDef projects fill:#42A5F5,color:white;
                        class C,S1,C1,T1 teams;
                        class P1,P2,P3 projects;
Freelance collective organization showing skill teams and project assignments.
This approach helped them visualize collaboration opportunities, balance workloads across the collective, and present a more cohesive structure to potential clients. The visual organization map became a key tool for both internal coordination and external marketing.
Integrating Organization Maps with Other Business Systems
The true power of modern organization mapping comes from integration with other business systems. I've helped companies create interconnected ecosystems that maximize the value of their organizational visualizations.
Connecting with HR Information Systems
One of the most valuable integrations I implement is connecting organization maps with HR information systems. This creates a bidirectional flow of data that:
- Automatically updates organization maps when personnel changes occur in the HRIS
- Pulls employee profile information, photos, and contact details into the map
- Synchronizes reporting relationships and team assignments
- Maintains consistent data across systems
This integration eliminates the common problem of outdated organization charts by ensuring that visualizations always reflect current HR data.
Organization Maps in Onboarding
I've found that interactive organization maps dramatically improve the onboarding experience for new employees. Integrating maps into onboarding processes allows new hires to:
Navigation Benefits
- Explore team structures at their own pace
- Identify key collaborators across departments
- Understand both formal and informal networks
- See where they fit in the overall organization
Interactive Features
- Profile details on hover/click
- Search by name, role, or skill
- Virtual "introduction paths" to key contacts
- Department-specific orientation guides
Companies that have integrated interactive organization maps into their onboarding process report significantly faster time-to-productivity for new hires and stronger early relationship building.
Strategic Planning Integration
                    flowchart TD
                        S[Strategic Plan] --> G1[Growth Goals]
                        S --> T1[Transformation Initiatives]
                        G1 --> O1[Org Map: Current State]
                        G1 --> O2[Org Map: 6-Month Target]
                        G1 --> O3[Org Map: 1-Year Vision]
                        T1 --> R1[Reorganization Plans]
                        T1 --> C1[Capability Development]
                        R1 --> O2
                        R1 --> O3
                        C1 --> O2
                        C1 --> O3
                        classDef strategy fill:#FF8000,color:white;
                        classDef maps fill:#42A5F5,color:white;
                        classDef initiatives fill:#66BB6A,color:white;
                        class S,G1,T1 strategy;
                        class O1,O2,O3 maps;
                        class R1,C1 initiatives;
Organization maps integrated into strategic planning and transformation initiatives.
When working with leadership teams on strategic planning, I've found that organization maps become powerful tools for visualizing future states. Integrating maps into planning processes allows leaders to:
- Model different organizational scenarios to support strategic objectives
- Visualize resource allocation and structural changes needed for new initiatives
- Identify capability gaps that need to be addressed
- Communicate organizational evolution plans to stakeholders
Agentic Synchronization
One of the most exciting capabilities I've implemented with PageOn.ai is leveraging its Agentic features to keep organization maps synchronized with other business tools. This creates an intelligent system that:
- Monitors changes in connected systems and updates maps accordingly
- Alerts relevant stakeholders when significant organizational changes occur
- Identifies potential issues or inconsistencies between systems
- Suggests optimizations based on observed patterns and best practices
Custom Views for Different Stakeholders
Different audiences need different perspectives on organizational structure. I help companies create tailored views for specific stakeholder groups:
| Stakeholder | View Focus | Key Elements |
|---|---|---|
| Executives | Strategic overview | High-level structure, span of control, resource distribution |
| Department Managers | Team management | Detailed team structure, skills inventory, cross-functional connections |
| New Hires | Orientation | Key contacts, team context, relationship navigation |
| Project Managers | Resource planning | Skills distribution, availability, reporting relationships |
| HR Team | Personnel management | Complete structure, succession planning, vacancy management |
These tailored views ensure that each stakeholder group gets exactly the information they need in a format that's most useful for their specific purposes, maximizing the value of the organization mapping investment.
The Future of Organization Visualization
As someone deeply immersed in this field, I'm excited about the emerging trends and technologies that are reshaping how we visualize organizational structures. Let me share what I see on the horizon.
Emerging Trends in Organizational Charts Online

The evolution of organizational chart online technologies is accelerating, with several key trends emerging:
Adoption of emerging organization visualization technologies:
- Real-time data visualization that updates as organizational changes happen
- Network-based rather than hierarchy-based representations
- Integration of social network analysis to reveal informal structures
- Increased personalization of views based on user role and needs
- Mobile-first experiences that work seamlessly across devices
AI-Driven Predictive Modeling
Perhaps the most exciting development I'm seeing is the emergence of AI-driven predictive modeling for organizational design. These advanced systems can:
                    flowchart TD
                        D[Historical Data] --> AI[AI Analysis]
                        G[Growth Projections] --> AI
                        S[Strategic Goals] --> AI
                        AI --> P1[Organizational Structure Predictions]
                        AI --> P2[Collaboration Network Forecasts]
                        AI --> P3[Resource Allocation Recommendations]
                        P1 --> O[Optimized Organization Design]
                        P2 --> O
                        P3 --> O
                        classDef inputs fill:#FF8000,color:white;
                        classDef ai fill:#42A5F5,color:white;
                        classDef outputs fill:#66BB6A,color:white;
                        class D,G,S inputs;
                        class AI ai;
                        class P1,P2,P3,O outputs;
AI-driven predictive modeling process for organizational design optimization.
- Analyze historical organizational data to identify patterns of successful structures
- Simulate different organizational configurations to predict outcomes
- Recommend optimal team compositions based on skill distribution and collaboration patterns
- Identify potential bottlenecks or communication gaps in proposed structures
- Continuously learn and improve recommendations based on observed outcomes
These AI capabilities are transforming organization design from an art to a data-driven science, while still preserving the human judgment needed for effective implementation.
Interactive and Immersive Experiences
The future of organization visualization will be increasingly interactive and immersive. I'm already seeing early implementations of:

- Virtual reality interfaces for exploring complex organizational structures
- Augmented reality overlays that provide contextual information in physical workspaces
- Voice-controlled navigation and manipulation of organization maps
- Gamified elements that increase engagement with organizational information
- Collaborative virtual environments for organizational design sessions
The Impact of Team Dynamics Mapping
Advanced team dynamics mapping is having a profound impact on employee engagement and organizational effectiveness. Organizations that implement these tools are seeing:
Engagement Benefits
- Greater sense of belonging and connection
- Improved understanding of one's role and impact
- Enhanced ability to navigate the organization
- More effective collaboration across boundaries
Organizational Benefits
- More resilient communication networks
- Faster information flow across departments
- Better preservation of institutional knowledge
- More effective organizational change management
PageOn.ai's Role in the Future of Workplace Visualization
As I look to the future, I see PageOn.ai playing a pivotal role in shaping the next generation of workplace visualization tools through:
- Pioneering conversational interfaces for organization design and visualization
- Developing increasingly sophisticated AI models for organizational pattern recognition
- Creating seamless integration between visualization tools and other workplace systems
- Building accessible, intuitive interfaces that democratize organization mapping
- Advancing the science of visual communication for complex organizational concepts
The future of organization visualization is dynamic, intelligent, and deeply integrated with how organizations actually function. By embracing these emerging technologies and approaches, companies can create more resilient, adaptable, and transparent structures that support both operational excellence and employee engagement.
Transform Your Visual Expressions with PageOn.ai
Ready to revolutionize how your organization visualizes its structure? PageOn.ai's intuitive AI-powered platform makes it simple to create dynamic, insightful organization maps that evolve with your business.
Start Creating with PageOn.ai TodayEmbracing the Future of Organization Visualization
As we've explored throughout this guide, the transformation from static employee hierarchies to dynamic visual organization maps represents a fundamental shift in how we understand and communicate workplace structures.
I've seen firsthand how organizations that embrace modern mapping techniques gain significant advantages in clarity, collaboration, and adaptability. The tools and approaches we've discussed—from revealing hidden power structures to implementing AI-powered visualization—are accessible to organizations of all sizes and types.
As organizational complexity continues to increase with remote work, matrix structures, and cross-functional collaboration, the need for intuitive, dynamic visualization tools will only grow. PageOn.ai is at the forefront of this evolution, providing accessible yet powerful solutions that adapt to your unique organizational needs.
I encourage you to take the first step toward transforming how your organization visualizes its structure. Whether you're addressing specific pain points or preparing for future growth, modern organization mapping provides the clarity and insight needed to build more effective, engaged, and resilient teams.
You Might Also Like
Mastering Visual Harmony: The Art and Science of Cohesive Slide Layouts
Discover how to create visually harmonious slide layouts through color theory, typography, and spatial design. Learn professional techniques to elevate your presentations with PageOn.ai.
Beyond Bullet Points: Transform Your Text with Animated Visuals | PageOn.ai
Discover how to transform static bullet points into dynamic animated visuals that boost engagement by 40%. Learn animation fundamentals, techniques, and AI-powered solutions from PageOn.ai.
Building New Slides from Prompts in Seconds | AI-Powered Presentation Creation
Discover how to create professional presentations instantly using AI prompts. Learn techniques for crafting perfect prompts that generate stunning slides without design skills.
The Art of Data Storytelling: Creating Infographics That Captivate and Inform
Discover how to transform complex data into visually compelling narratives through effective infographic design. Learn essential techniques for enhancing data storytelling with visual appeal.