Revealing the Hidden Architecture: How to Map and Navigate Invisible Power Structures in Teams
Understanding the invisible forces that shape organizations beyond traditional hierarchies
I've spent years navigating the complex web of relationships that define modern organizations, and I've come to understand that the official organizational chart only tells a small part of the story. In my experience, the real power and influence in any team often flows through invisible channels that aren't documented anywhere.
This guide explores how we can identify, visualize, and navigate these hidden power structures to build more effective and transparent teams. Whether you're a team leader trying to understand why decisions aren't being implemented as expected, or a team member looking to navigate organizational politics more effectively, understanding the invisible architecture of influence is essential.
The contrast between formal organizational structure (left) and actual influence networks (right)
Let's dive into the world of invisible power structures and discover how modern visualization tools can help us make the hidden visible.
Understanding the Invisible Forces That Shape Organizations
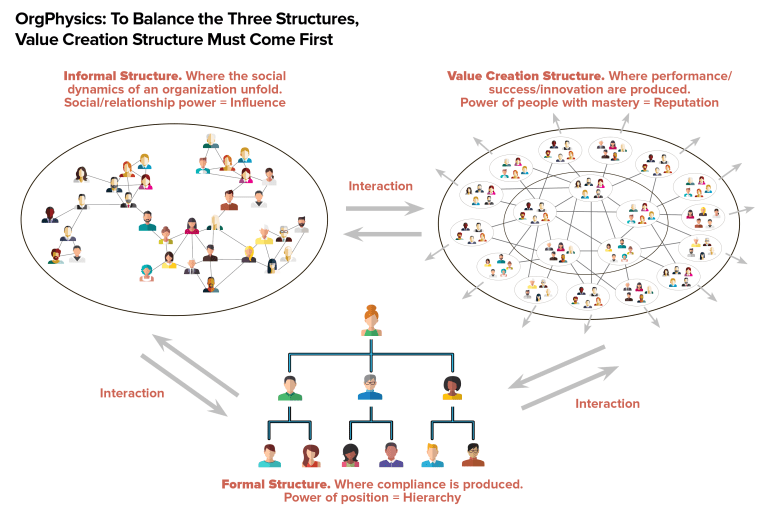
When I first started working with organizational dynamics, I quickly realized that power in teams extends far beyond what's captured in formal reporting structures. The traditional org chart shows who reports to whom, but it fails to capture how influence actually flows through an organization.
Key Distinction: Authority vs. Influence
Authority is the formal right to make decisions based on position in the hierarchy. Influence is the ability to affect decisions and behaviors regardless of formal position. Both are forms of power, but they operate through different mechanisms and are often held by different people.
                    flowchart TD
                        A[Formal Authority] -->|Visible| B[Documented Hierarchy]
                        C[Informal Influence] -->|Invisible| D[Actual Power Flow]
                        subgraph "Traditional View"
                        B --> E[Chain of Command]
                        B --> F[Official Reporting Lines]
                        B --> G[Job Titles & Positions]
                        end
                        subgraph "Reality"
                        D --> H[Trust Networks]
                        D --> I[Information Gatekeepers]
                        D --> J[Social Capital]
                        D --> K[Historical Relationships]
                        end
The dual nature of organizational power: formal vs. informal
In my work with dozens of teams, I've observed that invisible power structures manifest in several key ways:
- Information Flow: Who actually knows what's happening before others
- Decision Influence: Whose opinion carries weight regardless of title
- Resource Access: Who can get things done when formal channels stall
- Social Connectivity: Who maintains relationships across silos
- Credibility Networks: Whose expertise is trusted beyond their domain
The impact of these unmapped dynamics on team performance can be profound. I've seen projects fail not because of technical issues but because they didn't account for the real power landscape. Decisions get undermined, resources get redirected, and initiatives stall when they run counter to these invisible structures.
Comparative impact of mapped vs. unmapped power structures on team performance metrics
Understanding these invisible forces isn't just academic—it's practical. When I can see how influence actually flows, I can communicate more effectively, build stronger alliances, and help my team navigate complex organizational waters with greater success.
Identifying Key Power Players and Influence Networks
Through my years of consulting with organizations, I've developed a systematic approach to identifying the real power players in any team. These aren't always the people with impressive titles or the highest positions on the organizational chart. Instead, they're often the individuals who have built significant influence through various means.

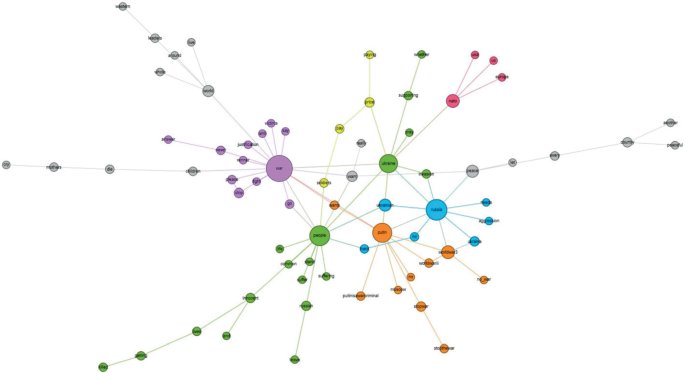
Social network analysis revealing central influencers (blue) and peripheral team members (orange)
When mapping informal power structures, I look for these key roles that often wield outsized influence:
Connectors
Individuals who maintain relationships across different departments or teams, serving as bridges between otherwise disconnected groups.
Information Brokers
People who consistently know what's happening before others and control the flow of critical information throughout the organization.
Cultural Anchors
Long-tenured employees who embody organizational values and whose opinions carry significant weight in discussions about direction and change.
Resource Gatekeepers
Those who control access to important resources (budget, talent, technology) regardless of their formal authority to do so.
Signs of Invisible Power at Work
I've found that invisible power structures leave telltale signs that can be observed in everyday team interactions. Learning to spot these indicators has been crucial in my work mapping organizational dynamics.
                    flowchart TD
                        A[Signs of Invisible Power] --> B[Decision Patterns]
                        A --> C[Meeting Dynamics]
                        A --> D[Resource Allocation]
                        A --> E[Information Control]
                        B --> B1["Decisions 'pre-made' before formal meetings"]
                        B --> B2["Certain people's objections carry more weight"]
                        C --> C1["Who speaks first/last"]
                        C --> C2["Whose ideas get built upon"]
                        C --> C3["Eye contact patterns during discussions"]
                        D --> D1["Projects getting prioritized unexpectedly"]
                        D --> D2["Uneven distribution of support resources"]
                        E --> E1["Selective information sharing"]
                        E --> E2["Private channels vs. public communication"]
Observable indicators of invisible power dynamics in organizational settings
One particularly revealing technique I use is to observe meeting dynamics carefully. In virtually every team I've worked with, the patterns of interaction in meetings—who speaks, who gets interrupted, whose ideas get picked up and developed—reveal the true power structure more accurately than any org chart.
Power Mapping Exercise
I often recommend this simple but effective exercise to teams:
- For one week, track who you go to when you need to get something done quickly
- Note who you consult before making important decisions
- Observe who gets consulted by others most frequently
- Map these interaction patterns and compare to the formal org chart
- The differences reveal your team's invisible power structure
Using social network analysis tools has dramatically enhanced my ability to visualize these invisible structures. By mapping communication patterns, decision influences, and resource flows, I can create visual representations that make the invisible visible. This approach transforms abstract concepts into concrete insights that teams can act upon to improve their effectiveness.
Visualizing Complex Team Dynamics with Modern Tools
The limitations of traditional organizational charts have become increasingly apparent to me as I've worked with more complex and dynamic teams. Static boxes and lines simply cannot capture the fluid nature of modern organizational relationships. Fortunately, we now have access to powerful tools that can help us visualize these complex dynamics in much more meaningful ways.
I've found that AI-powered organizational chart technologies have revolutionized how we understand team structures. These tools go beyond simple reporting relationships to incorporate data about communication patterns, collaboration frequency, and influence networks.
Interactive visualization of team dynamics created with PageOn.ai's AI Blocks
In my practice, I've started using PageOn.ai's AI Blocks to build interactive relationship maps that capture both formal and informal connections. This approach allows me to:
- Layer multiple types of relationships in a single visualization
- Highlight influence pathways that cross formal reporting lines
- Identify bottlenecks in information flow and decision processes
- Show how power structures shift in different contexts (e.g., crisis vs. normal operations)
- Create interactive maps that teams can explore from different perspectives
From Data to Insight
The most powerful aspect of modern visualization tools is their ability to transform raw data into actionable insights. I've developed a methodology for collecting and analyzing various data sources to reveal hidden patterns in team interactions.
Radar chart comparing the influence profiles of formal leaders vs. informal influencers across different dimensions
I've found that tracking changes in team dynamics over time provides particularly valuable insights. Organizations aren't static—power structures shift with new projects, leadership changes, and strategic pivots. Modern visualization tools allow me to create dynamic representations that capture these evolutionary patterns.
Data Sources for Power Mapping
Communication Data:
- Email metadata (frequency, response times)
- Meeting attendance and speaking time
- Chat platform interactions
Collaboration Patterns:
- Document co-editing statistics
- Project management tool interactions
- Cross-functional initiative participation
Influence Indicators:
- Decision implementation tracking
- Idea adoption patterns
- Resource allocation outcomes
Relationship Mapping:
- Self-reported trust networks
- Observed consultation patterns
- Knowledge-seeking behaviors
By integrating these diverse data sources and visualizing them effectively, I can help teams develop a much deeper understanding of their actual working dynamics. This visibility transforms how teams operate, enabling more intentional collaboration and more effective navigation of the organization's real power landscape.
The Political Landscape: Navigating Organizational Politics Effectively
In my experience, the term "office politics" often carries negative connotations, but I've come to see organizational politics as simply the human dynamics that emerge whenever people work together toward shared goals with limited resources. Understanding these dynamics isn't about manipulation—it's about effectiveness.
Strategic influence map showing coalition relationships in a matrix organization
I've observed that coalitions and alliances form naturally in organizations, creating informal power centers that may align with or cut across formal structures. These groupings typically form around:
- Shared professional backgrounds or disciplines
- Common strategic priorities or objectives
- Similar values or approaches to work
- Historical relationships from previous projects or teams
- Aligned interests in specific organizational outcomes
The unwritten rules that govern power in organizations are particularly fascinating to me. These cultural norms often determine whose voice carries weight and how influence flows, yet they're rarely documented or explicitly taught to new team members.
                    flowchart TD
                        A[Unwritten Rules of Organizational Power] --> B[Communication Norms]
                        A --> C[Decision Protocols]
                        A --> D[Influence Currency]
                        A --> E[Alliance Building]
                        B --> B1["When to use email vs. chat vs. in-person"]
                        B --> B2["What gets discussed publicly vs. privately"]
                        C --> C1["When consensus is required vs. optional"]
                        C --> C2["Whose buy-in is essential before proceeding"]
                        D --> D1["What carries weight: data, relationships, expertise"]
                        D --> D2["How credit and visibility are distributed"]
                        E --> E1["Acceptable ways to form coalitions"]
                        E --> E2["How cross-functional support is secured"]
Common unwritten rules that govern organizational power dynamics
I've found that executive presence plays a significant role in how power is perceived and exercised in organizations. This quality—a combination of communication style, confidence, decision-making approach, and personal presentation—often determines whether someone is seen as influential regardless of their formal position.
Ethical Influence Strategies
Based on my experience, these approaches help navigate power structures ethically:
- Relationship building: Cultivate authentic connections across different organizational groups
- Value creation: Focus on generating mutual benefits rather than zero-sum outcomes
- Transparency: Be clear about your objectives while respecting organizational norms
- Coalition alignment: Find common ground between your goals and others' priorities
- Reciprocity: Offer support and resources to others before you need their help
In diverse teams, power imbalances can be particularly challenging. I've observed how cultural differences in communication styles, deference to authority, and comfort with direct disagreement can create invisible barriers to participation. Effective power mapping must account for these differences and create structures that enable equitable influence across diverse team members.
Transforming Team Effectiveness Through Power Awareness
My most rewarding experiences have come from helping teams transform their effectiveness by developing collective awareness of their power dynamics. When team members understand how influence actually flows in their group, communication improves dramatically and collaboration becomes more authentic.
Measured improvements in team performance metrics after implementing power structure awareness
One of the most effective applications I've found for power mapping is in designing impactful project team presentations. When I understand the real influence landscape, I can structure information and recommendations in ways that address both formal requirements and informal concerns.
Power-Aware Presentation Strategies
Acknowledge Multiple Stakeholders
Structure content to address the concerns of both formal decision-makers and informal influencers who will affect implementation.
Pre-socialize Key Points
Share critical ideas with influential team members before formal presentations to build support and refine messaging.
Visualize Complex Relationships
Use PageOn.ai's visualization tools to illustrate interdependencies and collaboration requirements.
Create Implementation Roadmaps
Show awareness of how decisions will flow through both formal and informal channels during execution.
Building more inclusive decision-making processes has been another powerful outcome of power mapping work. By making invisible structures visible, teams can create intentional processes that balance efficiency with broader participation.

Using PageOn.ai's Vibe Creation tool to facilitate a team discussion about power dynamics
I've found that PageOn.ai's Vibe Creation tool provides an excellent platform for facilitating difficult conversations about team dynamics. The visual nature of the tool creates psychological distance that makes it easier to discuss sensitive topics like influence and power without triggering defensive reactions. Teams can collaboratively map their own dynamics and develop shared understanding that transforms how they work together.
Case Studies: Revealing and Reshaping Power Structures
Throughout my career, I've had the opportunity to work with organizations across different stages and industries. These experiences have shown me how power structures evolve and how making them visible can transform organizational effectiveness.
Startup Evolution: From Flat to Complex
I worked with a technology startup that prided itself on its flat structure and lack of hierarchy. As they grew from 15 to 50 people, informal power structures began to emerge that contradicted their espoused values. By mapping these emerging structures, we were able to:
- Identify information bottlenecks that were slowing decision-making
- Recognize the outsized influence of early employees that was inhibiting new voices
- Create intentional structures that preserved agility while scaling coordination
- Design onboarding processes that made implicit power norms explicit
                    flowchart TD
                        A[Startup Evolution Phases] --> B[Founding Team]
                        A --> C[Early Growth]
                        A --> D[Scale-up]
                        A --> E[Maturity]
                        B --> B1["Shared power based on complementary skills"]
                        B --> B2["Direct communication across all members"]
                        C --> C1["Informal leaders emerge by function"]
                        C --> C2["Information starts flowing through key people"]
                        D --> D1["Shadow hierarchies form"]
                        D --> D2["Influence concentrates in founding circle"]
                        D --> D3["New hires struggle to navigate implicit structure"]
                        E --> E1["Formal vs. informal structures diverge"]
                        E --> E2["Power redistribution tensions emerge"]
                        E --> E3["Need for intentional power mapping increases"]
Evolution of power structures through startup growth phases
The founding team profile has a profound influence on how power structures evolve. I've observed that the initial power dynamics established among founders often create patterns that persist throughout the organization's development, even as it grows significantly larger.
Enterprise Transformation: Mapping Resistance Networks
In a large financial services organization undergoing digital transformation, the formal change management process was failing despite strong executive sponsorship. By mapping the informal influence networks, we discovered:
- Middle managers with strong informal influence were quietly resisting the change
- Technical experts whose support was critical were not included in planning
- The transformation team had strong formal authority but weak informal influence
- Communication was flowing through unofficial channels that contradicted official messaging
By redesigning the change approach to work with rather than against these informal power structures, the transformation accelerated dramatically. We created a "shadow governance" structure that engaged informal influencers alongside formal leaders, which proved far more effective than the original approach.
Remote Work Revolution: Virtual Power Dynamics
Comparative visualization of in-office vs. remote work influence networks
The shift to remote and hybrid work has fundamentally altered how power flows in organizations. In my work with teams navigating this transition, I've observed fascinating changes:
Communication Platform Fluency
Team members who excel at digital communication gain influence, while those who relied on in-person charisma may lose standing.
Visibility Dynamics
New power centers form around those who maintain presence and connection despite physical distance.
Documentation Leverage
Those who document decisions and knowledge gain outsized influence as organizational memory becomes more critical.
Access Inequities
Power concentrates among those with access to in-person interactions when some team members are remote and others are on-site.
These case studies demonstrate that power mapping isn't just an academic exercise—it's a practical tool for solving real organizational challenges. By making invisible structures visible, teams can work with rather than against the natural flow of influence, dramatically improving their effectiveness.
Building Power-Intelligent Organizations
My vision for truly effective organizations is one where power dynamics are understood, acknowledged, and intentionally designed rather than left to evolve by accident. Building this kind of "power intelligence" requires specific tools and practices.
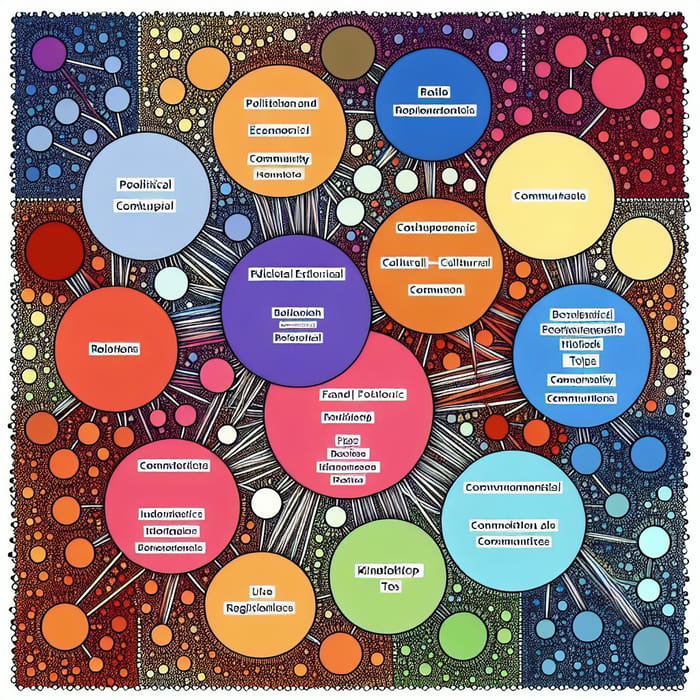
Creating organizational charts online that reflect both formal and informal realities is an important first step. Modern visualization tools allow us to move beyond static boxes and lines to create multi-dimensional maps that capture the complexity of real organizational relationships.

Multi-dimensional organizational map showing formal hierarchy and informal networks
Training leaders to recognize and work with invisible power structures has been one of my most important contributions to the organizations I've worked with. This involves developing specific competencies:
Comparison of traditional leadership development vs. power-intelligent leadership competencies
Designing team processes that balance efficiency with power awareness has proven to be particularly valuable. This involves creating structures that:
- Make decision rights and influence paths explicit
- Create transparency around how resources are allocated
- Establish feedback loops that surface power dynamics
- Balance the efficiency of hierarchy with the creativity of distributed influence
- Create safe spaces for discussing and adjusting power imbalances
I've found that PageOn.ai's Deep Search functionality provides an invaluable tool for gathering and integrating power-relevant data across organizations. By analyzing communication patterns, decision flows, and collaboration networks, Deep Search can identify emerging power structures before they become problematic or calcified.
Power-Intelligent Organization Assessment
Key questions I use to evaluate organizational power intelligence:
- Do formal leaders understand where informal influence resides?
- Are power dynamics explicitly discussed in strategic planning?
- Do team members across levels feel empowered to influence decisions?
- Are communication channels aligned with actual work flows?
- Is organizational political skill developed as a core competency?
- Are power imbalances addressed proactively rather than reactively?
- Do visualization tools capture both formal and informal structures?
Building truly power-intelligent organizations isn't easy, but I've seen it transform team effectiveness when done well. Organizations that develop this capability can navigate complex environments more nimbly, integrate diverse perspectives more effectively, and create more engaging and equitable workplaces.
Ethical Considerations and Future Trends
As I've developed my practice in power mapping and organizational dynamics, I've become increasingly aware of the ethical dimensions of this work. Making invisible structures visible carries significant responsibility.
Ethical Tensions in Power Mapping
Transparency vs. Privacy
How much detail about informal relationships should be made visible? Where is the line between helpful transparency and invasive surveillance?
Empowerment vs. Manipulation
How do we ensure power mapping tools are used to create more equitable organizations rather than to consolidate control or manipulate relationships?
Privacy concerns are particularly important when mapping interpersonal dynamics. I've developed guidelines for ethical power mapping that include:
- Focus on patterns rather than individual relationships when sharing visualizations
- Get consent before collecting relationship data through surveys or interviews
- Provide individuals with access to data about their own position in networks
- Use aggregate measures when possible to protect individual privacy
- Establish clear purposes for power mapping that benefit the collective
                    flowchart TD
                        A[Future of Organizational Power] --> B[Flatter Structures]
                        A --> C[AI-Augmented Influence]
                        A --> D[Network-Based Authority]
                        A --> E[Transparent Power Dynamics]
                        B --> B1["Distributed decision rights"]
                        B --> B2["Expertise-based influence"]
                        C --> C1["AI-identified optimal influencers"]
                        C --> C2["Algorithmic power mapping"]
                        C --> C3["Automated network optimization"]
                        D --> D1["Connection value over position value"]
                        D --> D2["Dynamic coalition formation"]
                        E --> E1["Real-time influence visualization"]
                        E --> E2["Power metrics as core KPIs"]
Emerging trends in organizational power structures
Looking to the future, I see several important trends that will shape how power operates in organizations:
The Evolution of Flatter Organizations
As organizations continue to flatten formal hierarchies, understanding informal influence becomes even more critical. Power doesn't disappear—it redistributes in more complex patterns.
AI-Augmented Organizational Intelligence
AI will increasingly help us identify patterns in organizational dynamics that human observation alone might miss, revealing subtle power structures and predicting their evolution.
Dynamic Team Structures
As organizations shift toward more fluid team structures, power mapping will need to become more dynamic, capturing how influence shifts across different contexts and projects.
Distributed Decision Intelligence
Tools that make decision processes and influence patterns visible will enable more distributed but coordinated decision-making across complex organizations.
As we look ahead, I believe organizations that develop sophisticated capabilities for understanding and working with power dynamics will have significant advantages. The ability to see, map, and intentionally design influence structures will become a core organizational competency rather than an occasional intervention.

Future vision: AI-powered real-time power dynamics dashboard
The organizations that thrive will be those that balance the efficiency of clear structures with the adaptability of fluid influence networks, creating environments where power flows in service of collective goals rather than individual interests. By making the invisible visible, we can create more effective, equitable, and engaging organizations.
Transform Your Team Dynamics with PageOn.ai
Ready to reveal the invisible power structures in your organization? PageOn.ai provides powerful visualization tools that help you map complex team dynamics, identify informal influence networks, and build more effective collaborative environments.
Bringing the Invisible to Light
Throughout this guide, I've shared my approach to mapping and navigating the invisible power structures that shape team dynamics. By making these hidden architectures visible, we create opportunities for more authentic collaboration, more effective decision-making, and more equitable participation.
The tools and techniques I've outlined—from social network analysis to interactive visualization—provide practical ways to understand and work with organizational complexity rather than against it. As teams become more distributed, diverse, and dynamic, this capability becomes increasingly valuable.
I encourage you to begin mapping the invisible power structures in your own organization. Start with simple observations, build your understanding over time, and use tools like PageOn.ai to create visualizations that transform abstract dynamics into concrete insights. By developing this power intelligence, you'll be better equipped to navigate organizational complexity and help your team achieve its full potential.
You Might Also Like
The Art of Instant Connection: Crafting Opening Strategies That Captivate Any Audience
Discover powerful opening strategies that create instant audience connection. Learn visual storytelling, interactive techniques, and data visualization methods to captivate any audience from the start.
Audience-Centered Pitching Techniques: Visual Strategies That Win Every Time
Discover powerful audience-centered pitching techniques using visual storytelling, interactive engagement, and benefit visualization strategies that consistently win over any audience.
Transform Any Content into Professional Slides: The Ultimate Conversion Guide
Learn expert techniques for converting documents, presentations, and visual content into professional slides with this comprehensive guide to content format transformation.
Transform Raw Text Data into Compelling Charts: AI-Powered Data Visualization | PageOn.ai
Discover how AI is revolutionizing data visualization by automatically creating professional charts from raw text data. Learn best practices and real-world applications with PageOn.ai.