Transforming Education Through AI-Powered Diagram Generation: A Visual Learning Revolution
Discover how artificial intelligence is reshaping educational visuals and enhancing learning outcomes
The intersection of artificial intelligence and education is creating powerful new ways to visualize complex concepts. As educators seek more effective methods to engage diverse learners, AI-powered diagram generation is emerging as a transformative tool that bridges understanding gaps and makes abstract concepts tangible. Join me as I explore this visual learning revolution and how it's changing the educational landscape.
The Evolution of Educational Diagrams
The journey from hand-drawn educational diagrams to AI-powered visual content represents one of the most significant shifts in educational technology. I've watched this transformation unfold over the years, and it's remarkable how far we've come.
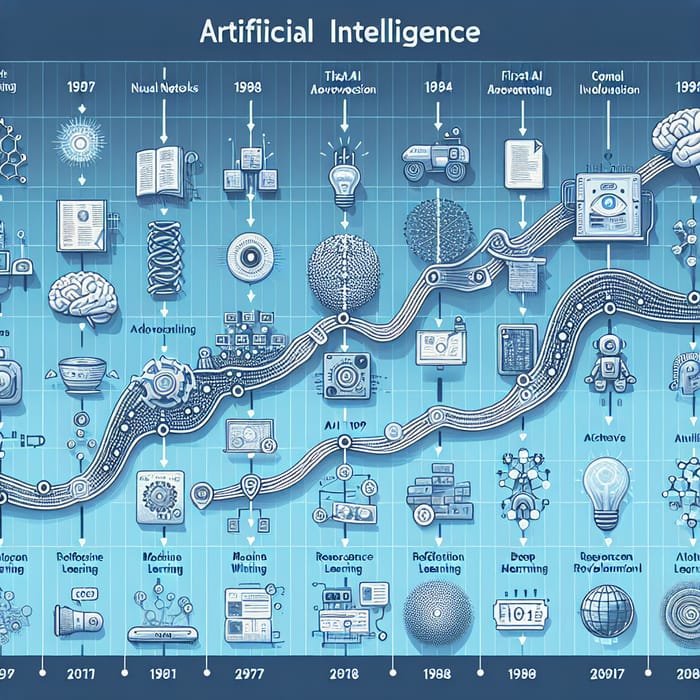
Historically, educators relied on manual creation of visual aids—from chalk drawings to overhead transparencies. The digital revolution brought tools like PowerPoint and specialized software, but these still required significant technical skills and time investment. Today, we're witnessing the next evolutionary leap with AI-powered diagram generators that can transform a simple text description into a sophisticated educational visual.
The cognitive science supporting this evolution is compelling. Research consistently shows that visual learning enhances retention by 29-42% compared to text-only learning. Our brains process visual information 60,000 times faster than text, making diagrams particularly powerful for conveying complex concepts. This is especially important in educational environments where time is limited and student attention spans vary widely.
What makes today's AI diagram generators particularly revolutionary is their accessibility. I've seen how generate teaching materials with AI has transformed from a technical challenge to an intuitive process. PageOn.ai's conversational approach removes barriers for educators who may lack design skills but possess deep subject matter expertise. Rather than learning complex software, teachers can simply describe the concept they want to visualize, and the AI generates an appropriate diagram.
The Evolution of Educational Visual Tools
The progression from traditional to AI-powered educational visuals:
                    flowchart LR
                        A[Traditional\nChalkboard Era] -->|Digital Revolution| B[Digital Tools\nEra]
                        B -->|AI Integration| C[AI-Assisted\nVisualization]
                        C -->|Conversational AI| D[Natural Language\nDiagram Generation]
                        style A fill:#f9f9f9,stroke:#ccc
                        style B fill:#f0f0f0,stroke:#ccc
                        style C fill:#FFF3E0,stroke:#FF8000
                        style D fill:#FFE0B2,stroke:#FF8000,stroke-width:2px
This democratization of visual content creation is perhaps the most significant development. No longer is high-quality educational diagram creation limited to those with graphic design skills or substantial time resources. Now, any educator can quickly generate visual explanations that previously might have taken hours to create manually.
Core Technologies Powering Educational Diagram Generation
Behind every AI-generated educational diagram lies a sophisticated stack of technologies working in concert. Understanding these technologies helps educators make better use of these tools and appreciate their capabilities and limitations.
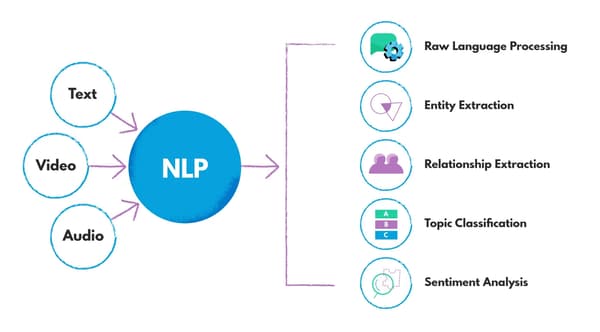
Natural Language Processing (NLP)
The foundation of modern diagram generators is advanced NLP that can interpret educational content and extract key concepts and relationships. When I input a description of photosynthesis, for example, the AI must recognize entities (sunlight, chlorophyll, carbon dioxide), processes (light absorption, chemical reactions), and their relationships to generate an accurate diagram.
Machine Learning Algorithms
The transformation from text to visual structure relies on machine learning models trained on millions of examples of diagrams and their textual descriptions. These models learn patterns that help them determine appropriate visual representations for different types of educational content. For instance, they learn that chemical reactions are typically shown with arrows, while hierarchical relationships use tree structures.
PageOn.ai's AI Blocks technology takes this a step further, allowing educators to build complex educational visuals like LEGOs. Rather than generating a single static diagram, the AI creates modular visual components that can be rearranged, customized, and built upon. This gives educators the flexibility to adapt generated diagrams to their specific teaching needs while maintaining the time-saving benefits of AI generation.
AI Approaches to Diagram Generation
Comparison of different AI methodologies for educational diagram creation:
                    flowchart TD
                        A[Input: Educational Content] --> B{AI Processing Approach}
                        B -->|Template-Based| C[Pre-defined\nVisual Templates]
                        B -->|Neural Networks| D[Deep Learning\nGeneration]
                        B -->|Hybrid Systems| E[AI Blocks\nModular Approach]
                        C --> F[Output:\nStandardized Diagrams]
                        D --> G[Output:\nNovel Visualizations]
                        E --> H[Output:\nCustomizable Components]
                        style A fill:#f9f9f9,stroke:#ccc
                        style B fill:#FFF3E0,stroke:#FF8000
                        style C fill:#f0f0f0,stroke:#ccc
                        style D fill:#f0f0f0,stroke:#ccc
                        style E fill:#FFE0B2,stroke:#FF8000,stroke-width:2px
                        style F fill:#f9f9f9,stroke:#ccc
                        style G fill:#f9f9f9,stroke:#ccc
                        style H fill:#FFE0B2,stroke:#FF8000,stroke-width:2px
Computer Vision Integration
Advanced educational diagram generators also incorporate computer vision capabilities. This is particularly valuable for scientific and mathematical diagrams where precision matters. For example, when generating molecular structures or geometric proofs, the AI can reference vast databases of visual information to ensure accuracy.
The most sophisticated AI chart generators combine these technologies with domain-specific knowledge bases. PageOn.ai, for instance, has been trained on educational standards and curriculum frameworks, enabling it to generate diagrams that are not only visually appealing but pedagogically sound and age-appropriate.
Types of Educational Diagrams Enhanced by AI
AI diagram generation has revolutionized various types of educational visuals, each serving different pedagogical purposes. I've found that understanding these different diagram types helps educators choose the right visual approach for their specific learning objectives.
Concept Maps and Mind Maps
Concept maps visualize relationships between ideas, making them perfect for subjects where interconnections matter. I've seen AI-generated concept maps transform abstract topics into clear visual hierarchies that students can easily navigate and understand.
AI-Generated Concept Map Example
A concept map showing the relationships between key components of photosynthesis:
                    flowchart TD
                        A[Photosynthesis] --> B[Light Reactions]
                        A --> C[Calvin Cycle]
                        B --> D[Chlorophyll]
                        B --> E[Water]
                        B --> F[Oxygen]
                        C --> G[Carbon Dioxide]
                        C --> H[Glucose]
                        style A fill:#FFE0B2,stroke:#FF8000,stroke-width:2px
                        style B fill:#E3F2FD,stroke:#2196F3
                        style C fill:#E8F5E9,stroke:#4CAF50
                        style D fill:#E3F2FD,stroke:#2196F3,stroke-dasharray: 5 5
                        style E fill:#E3F2FD,stroke:#2196F3,stroke-dasharray: 5 5
                        style F fill:#E3F2FD,stroke:#2196F3,stroke-dasharray: 5 5
                        style G fill:#E8F5E9,stroke:#4CAF50,stroke-dasharray: 5 5
                        style H fill:#E8F5E9,stroke:#4CAF50,stroke-dasharray: 5 5
PageOn.ai's Deep Search feature enhances these concept maps by automatically integrating relevant educational resources. When generating a concept map about climate change, for instance, the AI can pull in current data, research findings, and educational standards to ensure the map is both comprehensive and up-to-date.
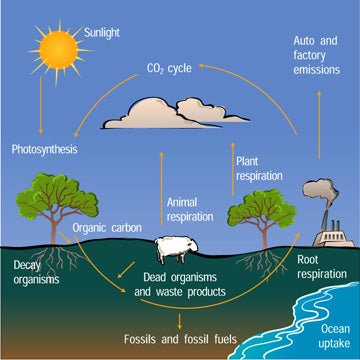
Scientific Diagrams and Models
Scientific processes and systems often require precise visualization to be properly understood. AI-generated scientific diagrams can transform abstract concepts into clear visual representations, making topics like cellular respiration or plate tectonics more accessible to students.
I've found that AI block diagram whiteboards are particularly effective for scientific concepts. They allow educators to build complex scientific models piece by piece, helping students understand both individual components and their relationships within a larger system.
Mathematical Visualizations
Mathematics often feels abstract to students, but AI-generated visualizations can make concepts tangible. From geometric proofs to calculus concepts, these visualizations help students see the relationships behind the equations.
Mathematical Function Visualization
Visual representation of different mathematical functions:
PageOn.ai excels at creating step-by-step visual problem-solving guides, breaking down complex mathematical processes into digestible visual sequences. This approach is particularly valuable for students who struggle with traditional mathematical notation but can grasp the concepts when presented visually.
Flowcharts and Process Diagrams
Sequential procedures and methodologies are often best explained through flowcharts. AI-generated flowcharts can illustrate everything from the scientific method to the steps in solving a particular type of problem.
The Scientific Method
A flowchart illustrating the scientific method process:
                    flowchart TD
                        A[Ask a Question] --> B[Do Background Research]
                        B --> C[Construct a Hypothesis]
                        C --> D[Test with an Experiment]
                        D --> E{Analyze\nResults}
                        E -->|Hypothesis\nConfirmed| F[Report Results]
                        E -->|Hypothesis\nNot Confirmed| G[Refine Hypothesis]
                        G --> D
                        style A fill:#FFE0B2,stroke:#FF8000
                        style B fill:#FFE0B2,stroke:#FF8000
                        style C fill:#FFE0B2,stroke:#FF8000
                        style D fill:#FFE0B2,stroke:#FF8000
                        style E fill:#FFE0B2,stroke:#FF8000
                        style F fill:#E8F5E9,stroke:#4CAF50
                        style G fill:#FFEBEE,stroke:#F44336
I've found that transforming lesson plans into visual learning journeys helps students understand not just what they're learning, but why each step matters in the broader educational context. This approach has been particularly effective for project-based learning where students need to understand complex multi-stage processes.
Practical Applications in Educational Settings
The theoretical benefits of AI-generated diagrams come to life when applied in specific educational contexts. I've observed how these tools adapt to different educational environments, each with unique requirements and challenges.
K-12 Education
In primary and secondary education, age-appropriate visualization is crucial. AI diagram generators can adjust the complexity and presentation style based on grade level, ensuring that visuals are neither too simplistic nor overwhelmingly complex.

Teachers using PageOn.ai can quickly generate diagrams during lesson preparation, often creating in minutes what might have taken hours with traditional design tools. This efficiency allows for more personalized visual content that supports diverse learning styles.
The ability to customize colors, shapes, and text complexity helps teachers create visuals that engage students with different learning preferences. Visual learners benefit from spatial representations, while verbal learners appreciate the integrated text explanations that AI can incorporate into diagrams.
Higher Education and Research
In university settings, the visualization needs become more sophisticated. Complex systems visualization for advanced subjects requires precise representation of intricate relationships and processes. AI lesson plan generators can help professors create visual supplements that clarify challenging theoretical frameworks.
Research Methodology Visualization Approaches
Comparison of different research visualization methodologies:
I've seen university professors use PageOn.ai to clarify complex theoretical frameworks in fields ranging from quantum physics to postmodern literary theory. The ability to quickly generate and iterate on visual explanations allows for rapid refinement based on student feedback.
Special Education
Perhaps one of the most impactful applications is in special education, where adapting diagrams for learners with different needs is essential. AI-generated visuals can be customized to support students with various learning differences.
For students with dyslexia, for instance, diagrams can incorporate specific color schemes and font choices that improve readability. For those on the autism spectrum who may benefit from clear, concrete visual representations, AI can generate diagrams with reduced abstraction and explicit labeling.
PageOn.ai's conversational interface makes visual creation accessible to all educators, regardless of their technical proficiency. Special education teachers can simply describe what they need in natural language, and the AI will generate appropriate visuals that can be further refined through conversation.
Professional Training and Development
Beyond traditional academic settings, AI-generated educational diagrams have found applications in corporate training and professional development. Complex workplace procedures and systems can be visualized to accelerate onboarding and skill development.
Corporate Training Process
A visualization of an effective corporate training workflow:
                    flowchart LR
                        A[Needs Assessment] --> B[Learning Objectives]
                        B --> C[Content Development]
                        C --> D[Visual Materials Creation]
                        D --> E[Training Delivery]
                        E --> F[Assessment]
                        F --> G[Feedback Loop]
                        G -.-> C
                        style A fill:#f9f9f9,stroke:#ccc
                        style B fill:#f9f9f9,stroke:#ccc
                        style C fill:#f9f9f9,stroke:#ccc
                        style D fill:#FFE0B2,stroke:#FF8000,stroke-width:2px
                        style E fill:#f9f9f9,stroke:#ccc
                        style F fill:#f9f9f9,stroke:#ccc
                        style G fill:#f9f9f9,stroke:#ccc
Organizations use PageOn.ai to create consistent visual training materials across departments and locations, ensuring that all employees receive standardized information presented in clear, engaging formats. This consistency is particularly valuable for companies with distributed workforces or complex procedural requirements.
The ability to quickly update and regenerate diagrams also makes these tools valuable in rapidly evolving fields where training materials need frequent revision. Rather than redesigning visuals from scratch, trainers can simply modify their prompts to reflect new information or processes.
Implementation Strategies for Educators
Having explored the technologies and applications of AI diagram generation, I want to share practical strategies for educators looking to incorporate these tools into their teaching practice. Effective implementation requires thoughtful planning and an understanding of how to get the best results from AI tools.
Step-by-Step Integration Guide
AI Diagram Implementation Workflow
A systematic approach to incorporating AI diagram tools into educational practice:
                    flowchart TD
                        A[Identify Learning Objectives] --> B[Select Appropriate Diagram Type]
                        B --> C[Draft Clear AI Prompt]
                        C --> D[Generate Initial Diagram]
                        D --> E{Review\nfor Accuracy}
                        E -->|Needs Refinement| F[Refine Prompt]
                        F --> D
                        E -->|Approved| G[Integrate into Lesson]
                        G --> H[Gather Student Feedback]
                        H --> I[Iterate and Improve]
                        style A fill:#f9f9f9,stroke:#ccc
                        style B fill:#f9f9f9,stroke:#ccc
                        style C fill:#FFE0B2,stroke:#FF8000
                        style D fill:#FFE0B2,stroke:#FF8000
                        style E fill:#f9f9f9,stroke:#ccc
                        style F fill:#FFE0B2,stroke:#FF8000
                        style G fill:#f9f9f9,stroke:#ccc
                        style H fill:#f9f9f9,stroke:#ccc
                        style I fill:#f9f9f9,stroke:#ccc
When incorporating AI diagram tools into lesson planning workflows, I recommend starting with clear learning objectives. What specific concept do you want students to understand? What misconceptions might they have? Having answers to these questions will guide your prompt creation.
Best Practices for Effective Prompting
The quality of AI-generated diagrams depends significantly on the prompts provided. I've found these strategies particularly effective:
- Be specific about the diagram type (concept map, flowchart, etc.)
- Include key terms and relationships that must be represented
- Specify the target audience and their prior knowledge
- Indicate any color schemes or visual preferences
- Request specific features like numbered steps or highlighted elements

PageOn.ai's agentic capabilities help educators refine their prompts through conversational interaction. Rather than requiring perfect prompts from the start, the system can ask clarifying questions and suggest improvements to help educators achieve their desired visual outcomes.
Balancing AI Assistance with Educational Expertise
While AI can generate impressive diagrams, the educator's expertise remains essential. I always recommend reviewing AI-generated content for:
- Factual accuracy and currency of information
- Alignment with curriculum standards and learning objectives
- Age-appropriateness and accessibility for your specific students
- Potential biases or oversimplifications
The most effective approach combines AI efficiency with human judgment. Use AI to generate initial diagrams quickly, then apply your educational expertise to refine and customize them for your specific teaching context. AI graphic generators work best as collaborative tools rather than autonomous replacements for educator input.
Customization Techniques
Once a diagram is generated, consider these customization approaches to better meet your specific learning objectives:
- Add annotations or questions to promote critical thinking
- Create sequential versions that build in complexity
- Develop complementary diagrams showing alternative perspectives
- Incorporate school colors or subject-specific visual conventions
- Add interactive elements for digital deployment
PageOn.ai's modular approach makes these customizations particularly straightforward. Rather than regenerating entire diagrams, educators can modify specific components while preserving the overall structure, saving time while ensuring the final visual perfectly matches their needs.
Measuring Impact and Educational Outcomes
As with any educational technology, it's essential to assess the impact of AI-generated diagrams on actual learning outcomes. I've found that a data-informed approach helps educators refine their use of these tools over time.
Research Findings on Student Engagement
Recent studies on visual learning tools provide valuable insights into the effectiveness of AI-generated educational diagrams. Research consistently shows that well-designed visual aids can increase student engagement by 40-60% compared to text-only materials.
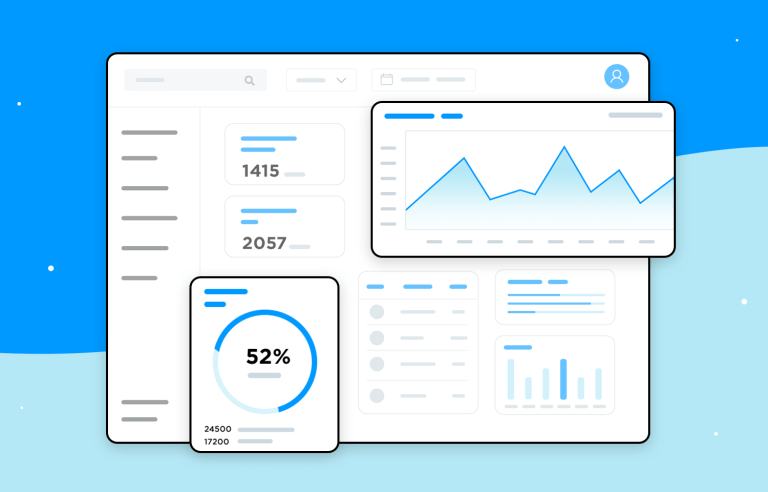
Student Engagement Metrics
Comparison of engagement metrics across different instructional approaches:
The most significant gains are typically seen in concept retention and application. When students can visualize abstract concepts, they're better able to recall and apply them in new contexts. This is particularly important for complex subjects where understanding relationships between concepts is crucial.
Assessment Strategies
To measure the impact of AI-generated diagrams on your specific students, consider these assessment approaches:
- Pre/post testing to measure knowledge gains
- Comparative studies using different visual approaches
- Student self-reporting on comprehension and engagement
- Performance on visual interpretation tasks
- Long-term retention assessments
I've found that combining quantitative metrics with qualitative feedback provides the most complete picture of effectiveness. Numerical scores tell part of the story, but student reflections on how diagrams helped them understand difficult concepts offer equally valuable insights.
Continuous Improvement Through Feedback
Establishing feedback mechanisms is essential for ongoing refinement of educational diagrams. Consider implementing:
- Quick polls after diagram-based lessons
- Student annotations identifying confusing elements
- Peer educator reviews of diagram effectiveness
- Tracking of questions asked during diagram-based instruction
PageOn.ai helps track and analyze student interaction with visual materials, providing educators with insights into which elements of diagrams are most effective and which might need revision. This data-driven approach allows for continuous refinement of visual teaching strategies.
By systematically collecting and analyzing this feedback, educators can develop best practices specific to their subject area and student population. Over time, this leads to increasingly effective use of AI diagram generation tools and better learning outcomes.
Ethical Considerations and Future Directions
As with any AI technology in education, diagram generation tools raise important ethical considerations that educators should be mindful of. I believe that addressing these concerns proactively is essential for responsible implementation.
Ensuring Accuracy and Avoiding Bias
AI systems are trained on existing data, which can sometimes contain inaccuracies or reflect societal biases. When generating educational content, it's particularly important to verify factual accuracy and examine diagrams for potential biases in representation or emphasis.
For example, AI might generate science diagrams that overrepresent certain demographic groups in scientific roles based on training data biases. Similarly, historical timelines might emphasize certain cultural perspectives while minimizing others. Educators should review generated content critically and make adjustments as needed.
Ethical Framework for AI in Education
Key considerations when implementing AI diagram tools:
                    flowchart TD
                        A[AI in Education\nEthical Framework] --> B[Accuracy\n& Truthfulness]
                        A --> C[Fairness\n& Inclusion]
                        A --> D[Privacy\n& Data Security]
                        A --> E[Transparency]
                        A --> F[Human\nOversight]
                        B --> B1[Fact Verification]
                        B --> B2[Source Citation]
                        C --> C1[Diverse Representation]
                        C --> C2[Accessibility]
                        D --> D1[Student Data Protection]
                        D --> D2[Consent Practices]
                        E --> E1[AI Disclosure]
                        E --> E2[Methodology Clarity]
                        F --> F1[Teacher Review]
                        F --> F2[Educational Purpose]
                        style A fill:#FFE0B2,stroke:#FF8000,stroke-width:2px
                        style B fill:#E3F2FD,stroke:#2196F3
                        style C fill:#E3F2FD,stroke:#2196F3
                        style D fill:#E3F2FD,stroke:#2196F3
                        style E fill:#E3F2FD,stroke:#2196F3
                        style F fill:#E3F2FD,stroke:#2196F3
Data Privacy Concerns
When using AI tools in educational settings, data privacy is a critical consideration. Educators should understand what student data might be collected, how it's stored, and how it might be used to train or improve AI systems.
PageOn.ai is developing responsible AI practices specifically for educational contexts, including transparent data policies and options for anonymized usage. This approach helps balance the benefits of personalized learning with the imperative to protect student privacy.
The Evolving Role of Educators
As AI diagram tools become more sophisticated, the role of educators is evolving rather than diminishing. I see educators shifting from being creators of all visual content to becoming curators and customizers who leverage AI to produce more varied and targeted visual materials.
This evolution allows educators to focus more energy on the higher-value aspects of teaching: designing meaningful learning experiences, providing personalized guidance, and fostering critical thinking skills. AI handles the time-consuming task of diagram creation, but educators provide the essential context and purpose that make these visuals meaningful.
Emerging Technologies and Future Capabilities
Looking ahead, several emerging technologies promise to further enhance educational diagram generation:
- Augmented reality integration for interactive 3D diagrams
- Personalized diagram generation based on individual learning profiles
- Real-time collaborative diagram creation between AI and multiple users
- Adaptive diagrams that evolve based on student interaction patterns
- Multi-modal generation combining visual, audio, and tactile elements
Future Technology Adoption Timeline
Projected adoption of emerging technologies in educational diagram generation:
These advancements will likely further transform how we teach and learn, making complex concepts more accessible and engaging for diverse learners. The key will be ensuring that these powerful tools remain aligned with sound pedagogical principles and ethical guidelines.
Getting Started: A Practical Guide
For educators interested in incorporating AI diagram generation into their practice, I've developed this practical guide to help you get started effectively. The right approach depends on your specific needs, technical comfort level, and educational context.
Selecting the Right AI Diagram Generation Tool
When evaluating AI diagram tools for educational use, consider these key factors:
| Feature | Why It Matters | PageOn.ai Advantage |
|---|---|---|
| Ease of Use | Reduces adoption barriers for busy educators | Conversational interface requires no technical skills |
| Diagram Variety | Supports different subjects and learning objectives | Comprehensive library of educational diagram types |
| Customization Options | Allows adaptation to specific learning needs | AI Blocks technology for modular customization |
| Export Capabilities | Ensures compatibility with existing platforms | Multiple format options (PNG, SVG, interactive HTML) |
| Educational Focus | Alignment with pedagogical best practices | Designed specifically for educational applications |
I recommend starting with a tool that offers a free trial or basic tier to evaluate its fit for your specific needs. PageOn.ai offers an educator-specific plan that includes features tailored to classroom use, making it an excellent starting point.
Initial Setup and Integration
Once you've selected a tool, follow these steps for smooth integration with your existing educational platforms:
- Create an account and explore available templates
- Connect with your learning management system if applicable
- Set up any subject-specific preferences or defaults
- Create a simple test diagram to familiarize yourself with the interface
- Establish a folder structure for organizing your generated diagrams
Building a Reusable Diagram Library
To maximize efficiency, I recommend building a library of reusable diagram templates for consistent visual teaching. Start with these core categories:
- Subject-specific concept map templates
- Process flowcharts for common procedures
- Comparison frameworks for contrasting concepts
- Timeline structures for historical or sequential content
- Problem-solving frameworks for your discipline
PageOn.ai's intuitive interface helps educators create professional diagrams from day one. The platform's template library provides starting points that can be customized and saved for future use, building an increasingly valuable personal resource over time.
Professional Development Resources
For educators new to AI-powered visual tools, these professional development resources can accelerate your learning curve:
- Online tutorials and webinars specific to educational applications
- Educator communities where members share successful diagram strategies
- Subject-specific examples and case studies demonstrating effective implementation
- Professional learning networks focused on visual teaching approaches
Many schools are also establishing "visual learning champions" who receive advanced training and then support colleagues in implementing AI diagram tools. This peer-to-peer support model has proven particularly effective for sustainable adoption.
Transform Your Visual Teaching with PageOn.ai
Create stunning educational diagrams in minutes, not hours. Join thousands of educators who are using AI to make complex concepts clear and engaging for all learners.
Start Creating with PageOn.ai TodayEmbracing the Visual Learning Revolution
As we've explored throughout this guide, AI-powered educational diagram generation represents a significant advancement in how we create and use visual learning materials. The technology continues to evolve rapidly, offering increasingly sophisticated tools for educators across all disciplines and levels.
I believe the most successful implementations will be those that thoughtfully blend AI capabilities with human educational expertise. The goal isn't to replace educator creativity but to amplify it—removing technical barriers and time constraints that have historically limited the use of visual teaching approaches.
PageOn.ai stands at the forefront of this visual learning revolution, offering educators an intuitive platform that transforms complex concepts into clear visual expressions. By combining conversational AI with deep educational understanding, it empowers teachers to create diagrams that truly enhance learning outcomes.
As you begin or continue your journey with AI-powered diagram generation, remember that the ultimate measure of success is student understanding. The most beautiful diagram is only valuable if it clarifies concepts, engages learners, and supports your educational objectives. With the right approach and tools, AI diagram generation can help you achieve all three.
You Might Also Like
Essential Elements Every Successful Startup Pitch Deck Must Include | PageOn.ai Guide
Discover the 9 essential elements every winning startup pitch deck needs, from compelling opening hooks to financial projections that captivate investors and secure funding.
The Art of Startup Storytelling: Creating Compelling Visual Investor Narratives
Transform your startup pitch with powerful visual storytelling techniques that captivate investors. Learn how to craft compelling narratives that convert complex ideas into funding opportunities.
Strategic Icon Selection Guide: Achieving Visual Consistency in Design Systems
Learn how to create visual harmony through intentional icon systems. Our comprehensive guide covers selection criteria, styling guidelines, and implementation strategies for cohesive design.
Mastering Live Product Demonstrations in Investor Meetings | Captivating Presentation Guide
Learn how to create powerful live product demonstrations that captivate investors, showcase your product's value, and help secure funding through strategic visual storytelling techniques.