Mastering Business Process Mapping: From Complexity to Clarity with Visual Tools
Transform your organization's workflows with effective process visualization
In today's complex business environment, understanding and optimizing your processes is no longer optional—it's essential for survival and growth. I've found that effective business process mapping is one of the most powerful tools for bringing clarity to complexity, enabling teams to work smarter and organizations to adapt faster.
Understanding the Foundations of Business Process Mapping
Business process mapping is a visual representation technique that allows organizations to document, analyze, and improve their workflows. In my experience working with various organizations, I've found that process mapping serves as the foundation for operational excellence and continuous improvement.
When we visualize workflows, we gain the ability to:
- Identify bottlenecks that slow down operations
- Spot redundancies that waste resources
- Recognize gaps in handoffs between departments
- Create standardized procedures for consistent execution
- Establish clear accountability for each process step
I've seen firsthand how process mapping can transform a chaotic, inefficient operation into a streamlined, predictable system that delivers consistent results while providing clarity for everyone involved.
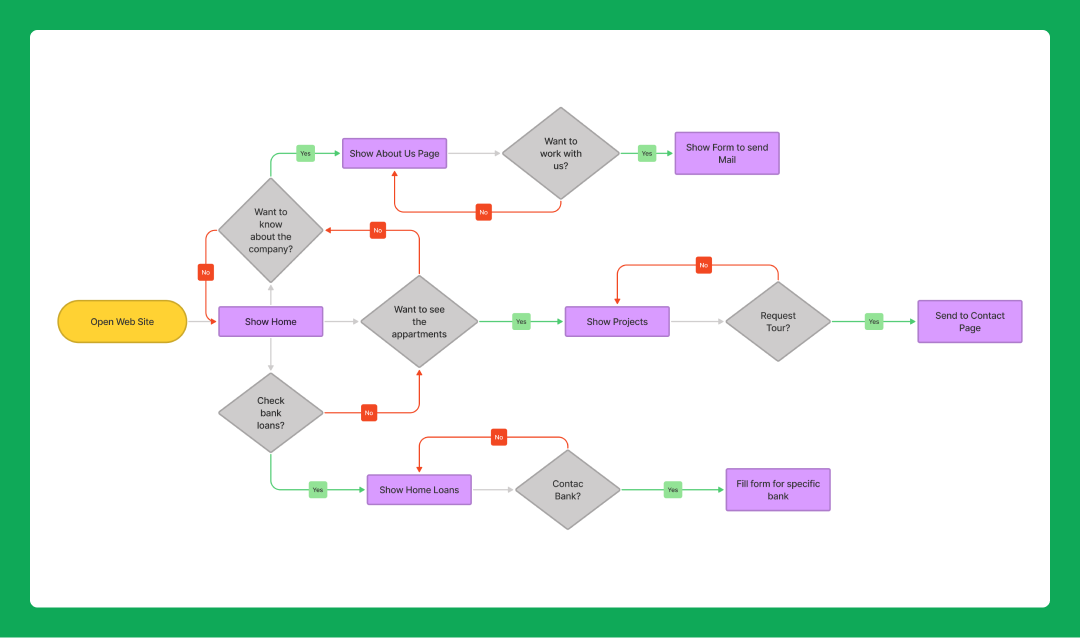
A typical business process map highlighting workflow steps and decision points
Common Types of Process Maps
| Map Type | Best For | Key Features |
|---|---|---|
| Flowcharts | Simple, linear processes | Easy to create, universally understood, shows sequence of steps |
| Swimlane Diagrams | Cross-functional processes | Shows responsibility by department, clarifies handoffs, identifies collaboration points |
| Value Stream Maps | Manufacturing & service delivery | Focuses on value-added activities, includes time metrics, highlights waste |
| SIPOC Diagrams | Process improvement projects | Identifies Suppliers, Inputs, Process, Outputs, and Customers |
The importance of process visualization extends beyond operational efficiency. In my work with cross-functional teams, I've observed that process maps create a shared language and understanding that breaks down silos between departments. They're also invaluable for onboarding new team members, who can quickly grasp complex workflows through visual representations rather than lengthy text documents.
For organizations looking to implement entrepreneurial decision mapping, process maps serve as the foundation for identifying key decision points and creating more agile, responsive operations.
Essential Preparation Steps Before Mapping
Before diving into creating a process map, I've learned that thorough preparation is crucial for success. In my experience, the most effective process mapping initiatives begin with careful planning and stakeholder alignment.
Pre-Mapping Checklist
- ✓ Define scope boundaries: Establish clear start and end points
- ✓ Identify key stakeholders: Include process owners, users, and subject matter experts
- ✓ Set specific objectives: Determine what you want the process map to achieve
- ✓ Gather documentation: Collect existing process information, metrics, and pain points
- ✓ Consider working backward: Start from desired outcomes for better focus
                    flowchart TD
                        A[Define Scope] --> B[Identify Stakeholders]
                        B --> C[Set Objectives]
                        C --> D[Gather Documentation]
                        D --> E[Plan Mapping Approach]
                        E --> F[Schedule Mapping Sessions]
                        style A fill:#FF8000,color:white
                        style B fill:#FF8000,color:white
                        style C fill:#FF8000,color:white
                        style D fill:#FF8000,color:white
                        style E fill:#FF8000,color:white
                        style F fill:#FF8000,color:white
Preparation workflow for successful process mapping
Setting Clear Scope Boundaries
One of the most common mistakes I see in process mapping initiatives is failing to establish clear scope boundaries. Without defined start and end points, process maps can quickly become unwieldy and lose focus. As recommended in Asana's process mapping guide, setting the scope is essential before you begin mapping.
I recommend asking these key questions when defining scope:
- What triggers the start of this process?
- What specific outcome marks the end of the process?
- Which departments or roles are involved?
- What level of detail is necessary for our objectives?
- Are there subprocesses that should be mapped separately?
When working with stakeholders, I've found that gathering their perspectives early in the process is invaluable. Each stakeholder brings a unique view of how the process works in practice, often revealing disconnects between the documented procedure and actual execution. This insight is crucial for creating an accurate current-state map that reflects reality rather than an idealized version of the process.
Selecting the Right Process Mapping Methodology
Choosing the appropriate process mapping methodology is critical to creating maps that effectively communicate and drive improvement. In my work with various organizations, I've found that different methodologies serve different purposes, and selecting the right one depends on your specific objectives.

Common process mapping notations and their distinctive elements
Standard Process Mapping Notations
| Notation | Complexity Level | Best Use Cases | Key Advantages |
|---|---|---|---|
| BPMN (Business Process Model & Notation) | High | Complex business processes, IT implementation | Standardized, detailed, supports automation |
| UML Activity Diagrams | Medium-High | Software development, system design | Object-oriented, supports parallel activities |
| Basic Flowcharts | Low | Simple processes, training materials | Easy to create, universally understood |
| Swimlane Diagrams | Medium | Cross-functional processes | Clear responsibility assignment |
Matching Techniques to Business Needs
When selecting a mapping methodology, I always consider the following factors:
- Audience: Who will be using the process map? Technical audiences may benefit from more detailed notations like BPMN, while general business users might prefer simpler flowcharts.
- Process complexity: More complex processes with multiple decision points and parallel activities require more sophisticated notations.
- Purpose: Is the map for documentation, analysis, improvement, or automation? Each purpose may suggest a different approach.
- Available tools: Consider what mapping tools your organization has access to and their capabilities.
Comparison of process mapping methodologies across key dimensions
I've found that balancing simplicity with necessary detail is one of the most challenging aspects of process mapping. Too much detail can overwhelm users and make the map difficult to understand, while too little detail can render the map ineffective for analysis and improvement. The key is to include just enough information to fulfill the map's purpose without unnecessary complexity.
For organizations looking to enhance their data visualization for business intelligence, selecting the right process mapping methodology can significantly impact how effectively you communicate complex operational data.
Step-by-Step Process Map Creation
Creating an effective process map requires a systematic approach. Based on my experience, I've developed a structured method that ensures comprehensive and accurate process documentation.
                    flowchart TD
                        A[Document Current State] --> B[Identify Process Owners]
                        B --> C[Map Inputs & Outputs]
                        C --> D[Add Decision Points]
                        D --> E[Include Alternative Paths]
                        E --> F[Standardize Symbols]
                        F --> G[Apply Color-Coding]
                        style A fill:#FF8000,color:white
                        style B fill:#FF8000,color:white
                        style C fill:#FF8000,color:white
                        style D fill:#FF8000,color:white
                        style E fill:#FF8000,color:white
                        style F fill:#FF8000,color:white
                        style G fill:#FF8000,color:white
Step-by-step process map creation workflow
1. Document the Current State
I always start by mapping the process as it currently exists, not as it should be. This approach reveals the reality of operations and provides a baseline for improvement. When documenting the current state:
- Observe the actual process in action whenever possible
- Interview multiple participants to capture different perspectives
- Focus on what actually happens, not what's supposed to happen
- Document workarounds and informal procedures
2. Identify Process Elements
Process Owners
Identify who is responsible for each step of the process. Clear ownership ensures accountability and provides points of contact for questions or improvements.
Inputs & Outputs
Document what triggers each step (inputs) and what results from each step (outputs). This helps identify dependencies and ensures nothing is overlooked.
Decision Points
Clearly mark where the process flow changes based on specific conditions. Decision points often reveal opportunities for automation or standardization.
Alternative Pathways
Document exception handling and alternative process flows. Understanding how exceptions are managed often reveals inefficiencies or risks.
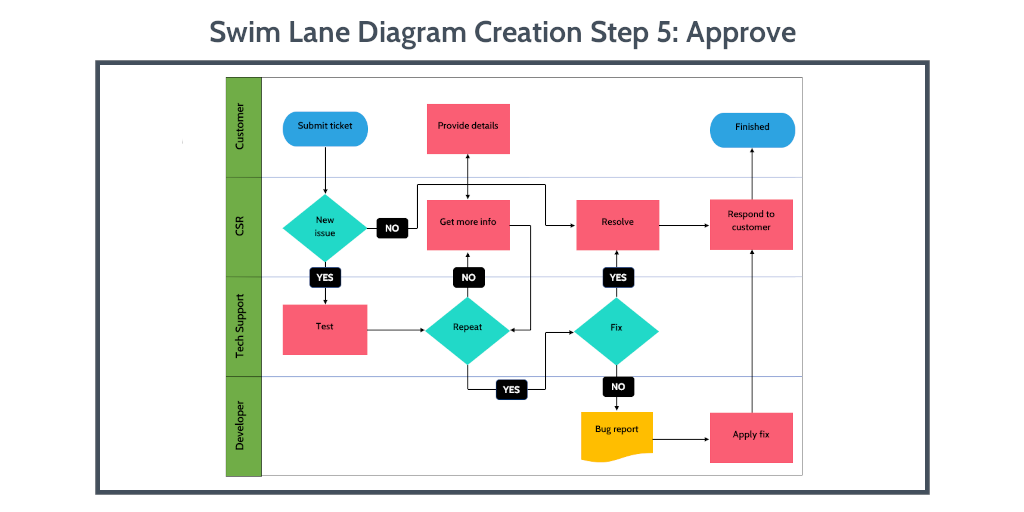
Example of a cross-functional swimlane process map with clear ownership
3. Use Standardized Symbols Consistently
Consistent use of standardized symbols is essential for creating maps that are easily understood by all stakeholders. Based on best practices in process mapping, I recommend using these common symbols:
Process Step
Decision Point
Start/End
Flow Direction
4. Apply Color-Coding Strategically
I've found that strategic use of color can significantly enhance the readability and impact of process maps:
- Red: Use for critical decision points or high-risk activities
- Green: Highlight value-adding steps or approved paths
- Yellow: Mark potential bottlenecks or areas needing attention
- Blue: Indicate automated steps or system interactions
- Gray: Show supporting or administrative activities
For organizations developing business proposal writing materials, clear process maps can significantly enhance the clarity and persuasiveness of your proposals by demonstrating a structured approach to implementation.
Leveraging Technology for Enhanced Process Mapping
While traditional methods of process mapping using pen and paper or whiteboards still have their place, I've seen how digital tools can dramatically enhance the creation, sharing, and maintenance of process maps. Modern technology offers powerful capabilities that transform process mapping from a static documentation exercise to a dynamic, collaborative tool for continuous improvement.
Comparison of process mapping approaches across key capabilities
The Power of AI in Process Mapping
AI-powered tools like PageOn.ai are revolutionizing how we approach process mapping. In my experience working with these advanced solutions, I've seen several transformative capabilities:
How PageOn.ai Transforms Process Mapping:
-
Natural Language Processing:
Simply describe your process verbally, and PageOn.ai transforms your description into a structured visual map, eliminating the need for manual diagram creation.
-
AI Blocks:
Build complex process hierarchies modularly, allowing you to zoom in on specific sub-processes while maintaining the big picture view.
-
Deep Search Integration:
Automatically incorporate relevant process metrics and KPIs from your existing business systems, creating data-enriched maps that provide context beyond just the process flow.
-
Collaborative Features:
Enable real-time stakeholder input and validation, making process mapping a truly collaborative effort rather than an isolated documentation exercise.
PageOn.ai's interface for transforming natural language descriptions into visual process maps
Digital Process Mapping Benefits
Version Control
Digital tools maintain a history of changes, allowing you to track process evolution over time and revert to previous versions if needed.
Real-time Updates
Changes are immediately visible to all stakeholders, ensuring everyone is working from the most current process documentation.
Integration Capabilities
Connect process maps to other business systems for real-time data display and automated updating based on actual performance.
Organizations looking to implement ai-powered organizational charts can leverage the same technology platforms for their process mapping needs, creating a unified visual language for both organizational structure and process flows.
From Mapping to Process Optimization
Creating a process map is just the beginning. The real value comes from using that map as a foundation for continuous improvement and optimization. In my work with process improvement initiatives, I've developed a systematic approach to transform static process documentation into dynamic optimization opportunities.
                    flowchart LR
                        A[Complete Process Map] --> B[Analyze for Inefficiencies]
                        B --> C[Question Value Contribution]
                        C --> D[Simulate Changes]
                        D --> E[Establish Metrics]
                        E --> F[Implement Improvements]
                        F --> G[Continuous Refinement]
                        G --> B
                        style A fill:#FF8000,color:white
                        style B fill:#FF8000,color:white
                        style C fill:#FF8000,color:white
                        style D fill:#FF8000,color:white
                        style E fill:#FF8000,color:white
                        style F fill:#FF8000,color:white
                        style G fill:#FF8000,color:white
The continuous process optimization cycle
1. Analyze for Inefficiencies
Once your process map is complete, it becomes a powerful tool for identifying inefficiencies:
- Look for loops: Processes that circle back repeatedly often indicate rework
- Count handoffs: Each transfer between departments or individuals creates potential for delays and errors
- Identify bottlenecks: Steps where work piles up or waits for resources
- Spot redundancies: Similar activities performed multiple times
- Find decision overload: Too many decision points can slow down execution
2. Question Value Contribution
For each step in the process, I recommend asking these critical questions:
- ? Does this step add value from the customer's perspective?
- ? Is this step necessary for legal, regulatory, or control purposes?
- ? Could this step be simplified or automated?
- ? What would happen if we removed this step entirely?
- ? Could these steps be combined or performed in parallel?
3. Simulate Changes Before Implementation
Before implementing process changes, I always recommend simulation to predict outcomes and identify potential issues:
Digital Twin Simulation
Create a digital model of your process and run simulations with different variables to predict performance under various conditions.
Pilot Testing
Implement changes on a small scale with a limited scope to identify issues before full-scale deployment.
What-If Analysis
Model different scenarios to understand the potential impact of process changes on throughput, quality, and cost.
Stakeholder Walkthroughs
Have key stakeholders mentally walk through the proposed process to identify potential issues from their perspective.
4. Establish Metrics for Process Performance
To drive continuous improvement, you need to measure process performance consistently:
Comparison of key process metrics before and after optimization
Key process metrics to consider include:
- Cycle time: Total time from process start to completion
- Error rates: Frequency of defects or mistakes
- Resource utilization: How efficiently people and equipment are used
- Cost per transaction: Total expense to complete one process cycle
- Customer satisfaction: How well the process meets customer expectations
5. Systematic Approach for Continuous Refinement
Process optimization is never truly complete. I recommend establishing a systematic approach to continuous refinement:
- Schedule regular process reviews (quarterly or bi-annually)
- Create a mechanism for capturing improvement suggestions from process participants
- Maintain a prioritized backlog of potential process improvements
- Implement changes in small, manageable increments
- Document and share the impact of improvements to build momentum
For organizations looking to enhance their reporting capabilities, AI business report generators can help translate process performance data into actionable insights for leadership decision-making.
Real-World Implementation Strategies
Even the most perfectly designed process map will fail to deliver value if it isn't effectively implemented across the organization. Based on my experience leading process improvement initiatives, I've developed strategies to ensure successful real-world implementation.
Developing Effective Communication Plans
Communication is the foundation of successful process implementation. I recommend a multi-layered approach:
                    flowchart TD
                        A[Executive Communication] --> B[Manager Briefings]
                        A --> C[Team Announcements]
                        B --> D[Detailed Training]
                        C --> D
                        D --> E[Ongoing Support]
                        E --> F[Feedback Collection]
                        F --> G[Iterative Improvement]
                        style A fill:#FF8000,color:white
                        style B fill:#FF8000,color:white
                        style C fill:#FF8000,color:white
                        style D fill:#FF8000,color:white
                        style E fill:#FF8000,color:white
                        style F fill:#FF8000,color:white
                        style G fill:#FF8000,color:white
Communication cascade for process implementation
Executive Messaging
Focus on strategic alignment, expected benefits, and organizational priorities to secure leadership support.
Manager Communication
Emphasize operational impacts, resource requirements, and implementation timelines to prepare for change.
Team Messaging
Detail day-to-day changes, training opportunities, and how the new process will make work easier or more effective.
Creating Effective Training Approaches
Training is critical for ensuring adoption and compliance with new process maps:

Interactive training session for process map implementation
- Role-specific training: Tailor content to different stakeholder groups based on their involvement in the process
- Hands-on workshops: Allow participants to walk through the process in a safe environment before real implementation
- Visual aids: Create simplified visual guides that highlight key steps and decision points
- Process champions: Identify and train internal experts who can support others during implementation
- Just-in-time resources: Provide easily accessible reference materials at the point of need
Establishing Governance Procedures
To ensure processes remain current and effective over time, governance procedures are essential:
Process Governance Framework
- 1. Define ownership: Clearly assign process owners responsible for maintenance and improvement
- 2. Establish review cycles: Schedule regular reviews (quarterly or annually) to ensure processes remain current
- 3. Create change management protocols: Document how process changes are proposed, approved, and implemented
- 4. Implement version control: Maintain a history of process changes with dates and rationales
- 5. Define escalation paths: Establish clear procedures for handling process exceptions or failures
Connecting to Organizational Objectives
To ensure sustained support and resources, process mapping initiatives must be clearly connected to broader organizational objectives:
Impact of process mapping on key organizational objectives
Documenting Success Stories
To build momentum and secure ongoing support for process mapping initiatives, I always recommend documenting success stories and calculating ROI:
- Before-and-after metrics: Quantify improvements in key performance indicators
- Financial impact: Calculate cost savings, revenue increases, or productivity gains
- Customer testimonials: Gather feedback on how process improvements have enhanced customer experience
- Employee stories: Document how process clarity has improved job satisfaction and reduced stress
- Case studies: Create detailed examples of successful process transformations for internal sharing
By implementing these strategies, I've seen organizations successfully transform their operations through effective process mapping and continuous improvement.
Advanced Process Mapping Techniques
As organizations mature in their process mapping capabilities, more advanced techniques become available to drive deeper insights and more sophisticated optimization. I've helped numerous organizations implement these advanced approaches to take their process management to the next level.
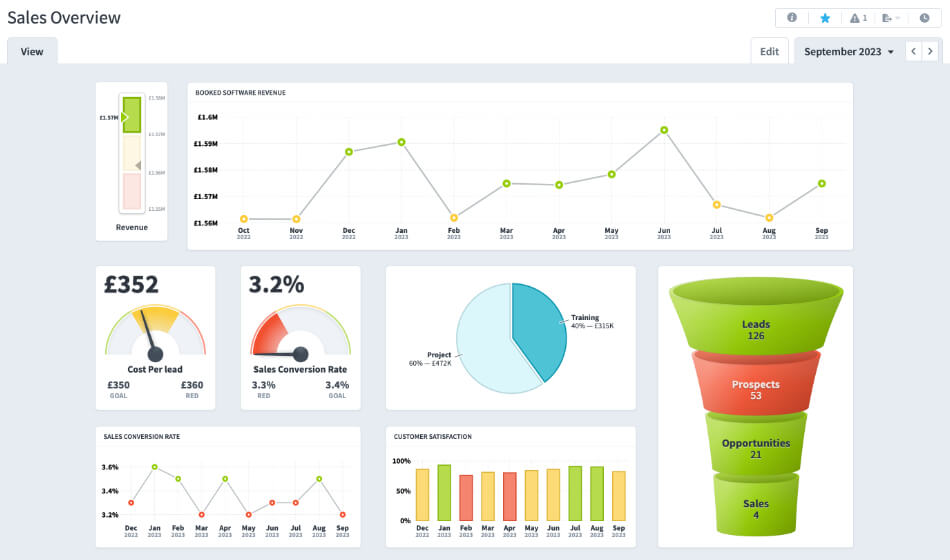
Integrating Data Visualization Elements
Modern process maps can be enhanced with integrated data visualization to provide real-time performance insights:
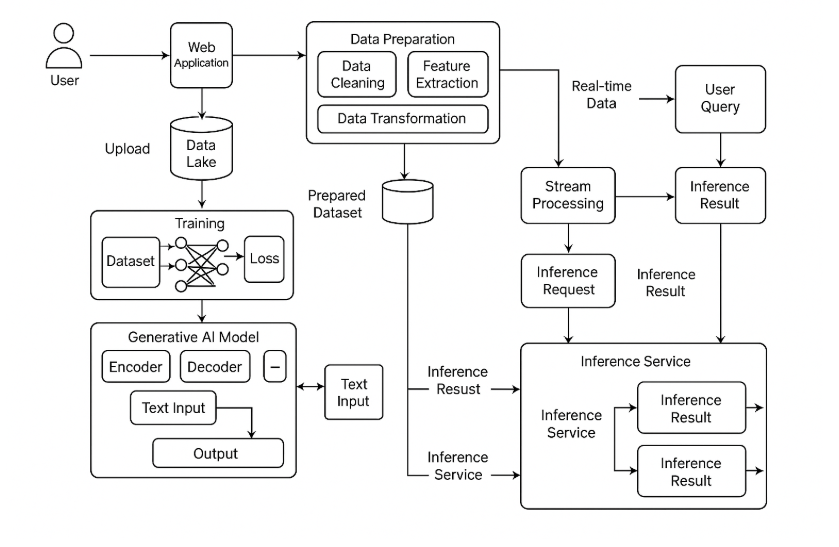
Process map enhanced with integrated data visualization elements
Key approaches for data-enhanced process maps include:
- Heat maps: Color-code process steps based on performance metrics (time, cost, error rate)
- Embedded charts: Include mini-charts within process steps to show historical performance
- Dynamic indicators: Use visual indicators that change based on real-time performance data
- Trend lines: Show performance trajectories alongside process steps
With PageOn.ai, these data visualizations can be automatically generated and integrated into your process maps, creating a dynamic view of operational performance that updates in real-time.
Hierarchical Process Mapping
For complex organizational systems, hierarchical process mapping provides a structured way to manage complexity:
                    flowchart TD
                        A[Level 1: Enterprise Process Map] --> B[Level 2: End-to-End Process Maps]
                        B --> C[Level 3: Detailed Process Maps]
                        C --> D[Level 4: Work Instructions]
                        B1[Order to Cash] -.-> B
                        B2[Procure to Pay] -.-> B
                        B3[Plan to Produce] -.-> B
                        C1[Sales Order Processing] -.-> C
                        C2[Credit Approval] -.-> C
                        C3[Order Fulfillment] -.-> C
                        style A fill:#FF8000,color:white
                        style B fill:#FF8000,color:white
                        style C fill:#FF8000,color:white
                        style D fill:#FF8000,color:white
Hierarchical process mapping structure for complex organizations
The hierarchical approach allows stakeholders to:
- Navigate from high-level process overviews to detailed work instructions
- Understand how individual processes fit into the broader organizational system
- Manage complexity through logical decomposition of processes
- Identify cross-process dependencies and integration points
Dynamic Process Maps
Advanced process mapping tools now enable the creation of dynamic maps that adapt based on conditional parameters:
Conditional Pathways
Process maps that display different paths based on selected variables (customer type, product category, regulatory requirements).
Interactive Decision Points
Click-through decision trees that guide users through complex decision logic with contextual information.
Real-time Adaptation
Maps that update based on current system status, resource availability, or business conditions.
Personalized Views
Role-based process displays that show only the steps and information relevant to specific user roles.
Connecting Process Maps to Strategic Outcomes
Advanced process mapping goes beyond operational documentation to connect processes directly to strategic business outcomes:
Strategic impact comparison between basic and advanced process mapping approaches
Methods for connecting processes to strategic outcomes include:
- Strategy alignment matrices: Map how specific process improvements support strategic objectives
- KPI cascades: Link process-level metrics to department and organizational KPIs
- Value stream connections: Show how process improvements contribute to overall value delivery
- Capability mapping: Connect processes to organizational capabilities that drive competitive advantage
Scenario Modeling for Process Resilience
Advanced process mapping tools enable scenario modeling to test process resilience under various conditions:
Common Scenario Tests:
- • Volume fluctuations: How does the process perform under 2x or 0.5x normal volume?
- • Resource constraints: What happens if key resources become unavailable?
- • Time pressure: How does the process adapt when cycle times must be reduced?
- • Regulatory changes: How flexible is the process to accommodate new requirements?
- • Technology failures: Are there manual backups for critical system dependencies?
With PageOn.ai's advanced visualization capabilities, these scenario tests can be visually modeled and shared with stakeholders, helping organizations build more resilient and adaptive processes that can withstand changing business conditions.
Transform Your Visual Expressions with PageOn.ai
Ready to take your business process mapping to the next level? PageOn.ai's intuitive AI-powered platform makes it easy to create stunning, interactive process maps that drive real business improvement.
Start Creating with PageOn.ai TodayBringing It All Together
Throughout this guide, I've shared my approach to creating effective business process maps that drive real organizational improvement. From understanding the foundations to implementing advanced techniques, the journey to process excellence is ongoing and iterative.
The most successful organizations I've worked with treat process mapping not as a one-time documentation exercise but as a living practice that evolves with the business. They use tools like PageOn.ai to make process visualization accessible to everyone in the organization, breaking down silos and creating a shared understanding of how value is created.
Whether you're just beginning your process mapping journey or looking to advance your current practices, remember that the ultimate goal is clarity—transforming complexity into visual expressions that drive understanding, alignment, and continuous improvement.
With the right approach and tools, your process maps can become powerful catalysts for organizational transformation, helping you navigate complexity and achieve new levels of operational excellence.
You Might Also Like
Beyond The Pitch: Visualizing Startup Traction Metrics That Win VC Funding
Discover the essential startup traction metrics that venture capitalists truly value. Learn how to visualize growth, efficiency, and revenue metrics to secure funding for your startup.
Transforming Industries with Language Models: From Summarization to Question Answering
Explore practical applications of language models from text summarization to question answering systems. Learn how LLMs are transforming healthcare, finance, e-commerce and more with PageOn.ai.
Essential Elements Every Successful Startup Pitch Deck Must Include | PageOn.ai Guide
Discover the 9 essential elements every winning startup pitch deck needs, from compelling opening hooks to financial projections that captivate investors and secure funding.
Visualizing the CIA Triad: A Modern Framework for Cybersecurity Success
Discover how the CIA triad (Confidentiality, Integrity, Availability) forms the foundation of modern cybersecurity. Learn implementation strategies and visualization techniques for security success.