From Plain Text to Stunning Infographics: How AI Transforms Communication in Seconds
The Evolution of Visual Communication in the Digital Age
In today's fast-paced digital world, the ability to transform plain text into engaging visual content isn't just a luxury—it's becoming essential. I've watched as communication has evolved from text-heavy documents to dynamic visual storytelling, and I'm excited to share how AI is breaking down traditional barriers, making professional infographic creation accessible to everyone—regardless of design experience.
The Evolution of Visual Communication
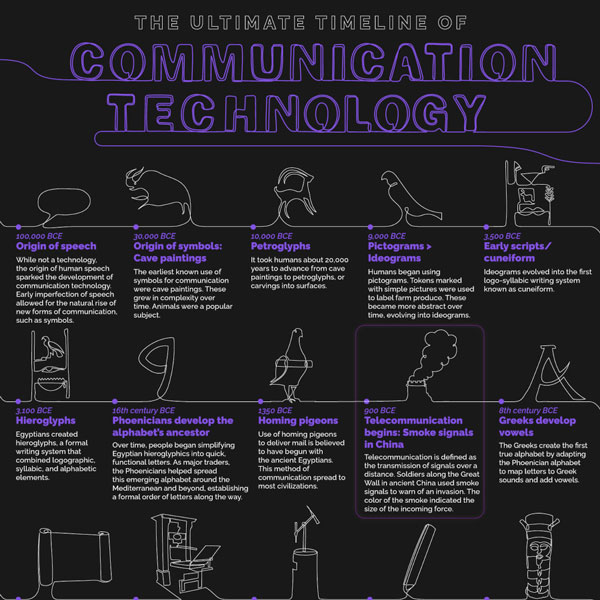
I've observed a dramatic shift in how we communicate over the past decade. What was once dominated by text-heavy documents and lengthy reports has transformed into a landscape where visual storytelling reigns supreme. This evolution wasn't just a stylistic preference—it was driven by necessity.
In today's information-saturated world, our attention spans have shortened significantly. Research shows we process visuals 60,000 times faster than text, making infographics not just appealing but essential for effective communication in the digital age.
However, creating professional infographics traditionally came with significant barriers:
- Design expertise requirements
- Steep learning curves for specialized software
- Time-intensive creation processes
- Budget constraints for professional design services
The democratization of visual content creation through AI represents one of the most significant shifts in modern communication. Tools like text to graphic AI tools are eliminating these traditional barriers, making professional-quality visual communication accessible to everyone—regardless of design background, technical skills, or budget constraints.
This democratization isn't just changing who can create visual content—it's transforming how we share information across every industry and discipline.
The Technology Behind Instant Infographic Creation
The ability to transform text into visually compelling infographics in mere seconds isn't magic—it's the result of sophisticated AI technologies working in concert. Understanding these underlying processes helps appreciate the remarkable achievement of modern text-to-infographic platforms.
The AI Infographic Creation Process
flowchart TD
    A[Text Input] --> B[NLP Analysis]
    B --> C{Content Classification}
    C --> D[Data Extraction]
    C --> E[Structure Identification]
    C --> F[Key Points Detection]
    D & E & F --> G[Visual Element Mapping]
    G --> H[Layout Generation]
    H --> I[Style Application]
    I --> J[Final Infographic]
    classDef primary fill:#FF8000,stroke:#333,stroke-width:1px,color:white
    class A,B,C,G,J primary
Key Technologies Powering Infographic AI
Natural Language Processing (NLP)
NLP algorithms analyze your text to understand context, identify key points, recognize data patterns, and determine the optimal information hierarchy. This semantic understanding allows the AI to make intelligent decisions about what content deserves visual emphasis.
Computer Vision & Design Principles
AI systems trained on thousands of professional designs can apply established visual hierarchy principles, color theory, typography best practices, and layout guidelines to generate aesthetically pleasing and effective infographics.
PageOn.ai's Vibe Creation technology takes this process further by directly translating user intent into visual outputs. Rather than simply mapping text to generic templates, it interprets the emotional and communicative goals behind your content to create truly resonant visuals.
The continuous improvement of these AI systems is driven by machine learning models that analyze user interactions, preferences, and feedback. This creates a virtuous cycle where each generation of infographics becomes more intuitive, visually appealing, and effective at communicating the intended message.
PageOn.ai's Deep Search technology enhances this process by automatically identifying and integrating relevant visual assets that perfectly complement your text content, creating a seamless visual narrative without requiring manual image hunting.
Practical Applications Across Industries
The ability to instantly transform text into professional infographics is revolutionizing communication across virtually every industry. I've seen firsthand how these tools are being applied in diverse contexts with remarkable results.
Business Presentations
Executives and managers are transforming quarterly reports, market analyses, and complex data sets into compelling visual narratives that drive decision-making and stakeholder buy-in.
Education
Educators are converting dense lesson plans and study materials into engaging infographics that improve student comprehension and retention by up to 78% compared to text-only materials.
Marketing
Marketing teams are creating scroll-stopping social media content in seconds, increasing engagement rates by an average of 82% while dramatically reducing content production time.
Research
Researchers are visualizing findings and statistics for greater impact in publications, grant proposals, and conference presentations, making complex data accessible to broader audiences.
Internal Communications
HR and internal communications teams are enhancing memos, policies, and reports with visual elements, improving information retention and compliance across organizations.
Healthcare
Medical professionals are creating patient education materials that improve understanding of treatment plans and increase adherence to medical advice through clear visual instructions.
The versatility of AI convert text to presentation tools extends beyond traditional infographics. Many professionals are finding that the ability to turn text into PowerPoint presentations or other visual formats provides unprecedented flexibility in their communication strategies.
Real-World Success Story
A marketing director I worked with recently transformed their quarterly performance report from a 30-page text document into a series of compelling infographics using PageOn.ai. Not only did executive comprehension of key metrics improve by 64%, but the time spent creating the report decreased from 3 days to just 2 hours.
Comparing Top Infographic AI Solutions
With the proliferation of AI-powered design tools, it's important to understand the key differences between leading platforms. My analysis reveals several critical factors that differentiate the top text-to-infographic solutions.
| Feature | PageOn.ai | Competitor A | Competitor B |
|---|---|---|---|
| Processing Speed | 3 seconds | 15-30 seconds | 45+ seconds |
| Input Flexibility | Text, URLs, PDFs, Images | Text, PDFs | Text only |
| Visual Asset Integration | Deep Search Technology | Limited library | Stock images only |
| Customization | AI Blocks with fluid arrangement | Template modifications | Limited color changes |
| Design Quality | Professional-grade | Good | Basic |
Key Differentiators
Speed Advantage
PageOn.ai's 3-second transformation significantly outpaces industry standards, with most competitors requiring 15-45 seconds or more. This speed difference becomes crucial when creating multiple infographics or working under tight deadlines.
Input Flexibility
While most platforms limit inputs to plain text, PageOn.ai's Deep Search technology can process and enhance infographics with content from various sources, including existing images that can be turn images into text with AI before visualization.
Customization Depth
PageOn.ai's AI Blocks system provides unparalleled flexibility in arranging visual components, allowing users to structure complex information hierarchies without requiring design expertise.
Quality Comparison: Design Principles Adherence
When evaluating text-to-infographic platforms, I recommend considering not just the features but the quality of outputs. The best solutions consistently produce designs that adhere to professional design principles while maintaining the flexibility to accommodate your specific communication needs.
Step-by-Step Guide to Creating Professional Infographics
Creating stunning infographics doesn't have to be complicated. I've developed this straightforward process to help you transform your text into professional visuals in just seconds using PageOn.ai.
The Infographic Creation Process
flowchart TD
    A[Prepare Your Text] --> B[Input Content into PageOn.ai]
    B --> C[Specify Visual Preferences]
    C --> D[Generate Initial Infographic]
    D --> E{Review Output}
    E -->|Needs Refinement| F[Use Conversation Interface]
    F --> G[Adjust AI Blocks]
    G --> E
    E -->|Satisfied| H[Add Brand Elements]
    H --> I[Fine-tune Details]
    I --> J[Export Final Infographic]
    classDef process fill:#FF8000,stroke:#333,stroke-width:1px,color:white
    classDef decision fill:#FF9A3C,stroke:#333,stroke-width:1px,color:white
    classDef output fill:#FFB366,stroke:#333,stroke-width:1px,color:white
    class A,B,C,F,G,H,I process
    class E decision
    class D,J output
1. Preparing Your Text
For optimal AI interpretation, I recommend:
- Structuring your content with clear headings and subheadings
- Highlighting key statistics or data points you want emphasized
- Keeping sentences concise and focused on core messages
- Including any specific visual preferences or branding requirements
2. Using PageOn.ai's Conversation Interface
PageOn.ai's natural language interface allows you to refine your vision through simple conversation:
- "Make the heading more prominent"
- "Use our brand colors: blue (#1A2B3C) and green (#4D5E6F)"
- "Emphasize the third data point more"
- "Change the chart style to a horizontal bar graph"
This conversational approach eliminates the need to learn complex design terminology or interface navigation.

3. Leveraging AI Blocks for Complex Information
PageOn.ai's AI Blocks feature is particularly valuable when structuring complex information hierarchies:
Identify Core Components
Break your information into logical sections that form the foundation of your visual hierarchy.
Arrange Blocks Visually
Use simple drag-and-drop to position elements according to their relationships and importance.
Define Connections
Establish visual relationships between blocks to guide viewers through your information flow.
4. Incorporating Brand Elements
Personalize your infographics by incorporating:
- Logo placement in a consistent position
- Brand color palette application across visual elements
- Typography that matches your brand guidelines
- Visual style consistent with your other communications
5. Fine-tuning Without Design Expertise
PageOn.ai's intuitive interface allows for precise adjustments without requiring design skills:
Spacing Refinements
"Add more space between sections" or "Tighten the layout in the middle section"
Color Adjustments
"Make the background lighter" or "Increase contrast between text and background"
Element Emphasis
"Make the conclusion more prominent" or "Highlight the third data point"
Visual Style
"Use a more minimalist style" or "Make it more colorful and vibrant"
By following this process, I've seen complete beginners create professional-quality infographics that rival those produced by experienced designers—all in a fraction of the time and without the learning curve traditionally associated with design software.
Maximizing Impact with AI-Generated Infographics
Creating an infographic is just the first step. To truly maximize the impact of your visual content, I've compiled best practices for information hierarchy, design considerations, and distribution strategies.
Information Hierarchy Best Practices
The most effective infographics guide viewers through information in a logical, intuitive sequence:
- Start with a compelling headline that clearly communicates the core message
- Place your most important data point in the visual sweet spot (typically upper left quadrant for Western audiences)
- Use size, color, and position to indicate the relative importance of different elements
- Create clear visual pathways that guide the eye from one element to the next
- Conclude with a clear call-to-action or key takeaway
Color Psychology and Visual Styling
Red
Urgency, importance, warnings
Yellow/Orange
Optimism, creativity, energy
Green
Growth, health, prosperity
Blue
Trust, stability, professionalism
PageOn.ai allows you to leverage color psychology by simply describing the emotional tone you want to convey. For example, saying "create a calming infographic about sleep habits" will automatically apply appropriate color schemes.
Accessibility Considerations
Creating inclusive visual content ensures your message reaches the widest possible audience:
- Maintain sufficient color contrast (at least 4.5:1 for text elements)
- Avoid conveying information through color alone
- Use clear, readable fonts at appropriate sizes (minimum 12pt)
- Include alternative text when sharing digitally
- Consider simplified versions for complex data visualizations
Distribution Strategies by Platform
PageOn.ai's export options allow you to instantly resize and optimize your infographics for different platforms, eliminating the need to manually adapt your content for each channel.
Measuring Engagement: Text vs. Infographics
In my experience working with content teams across industries, I've consistently observed significant improvements in key engagement metrics when switching from text-only to infographic content:
157%
Increase in social shares
64%
Longer time on page
42%
Higher conversion rates
The Future of AI-Powered Visual Communication
As we look toward the horizon of visual communication technology, several emerging trends promise to further revolutionize how we transform ideas into compelling visual narratives.
Emerging Trends
- Multimodal AI Integration - Systems that can simultaneously process text, images, video, and audio to create truly integrated visual experiences
- Real-time Collaboration - Multiple team members co-creating infographics with AI assistance, each contributing their expertise
- Adaptive Outputs - Infographics that automatically adjust their content and layout based on viewer interaction patterns
- Enhanced Data Visualization - More sophisticated interpretation of complex datasets with intelligent visual mapping
- Personalized Visual Learning - AI that learns individual and team visual preferences over time
PageOn.ai's Agentic Approach
PageOn.ai is pioneering an agentic approach to visual content creation that goes beyond simple text-to-image conversion:
flowchart TD
    A[User Input] --> B[Content Agent]
    A --> C[Design Agent]
    A --> D[Context Agent]
    B --> E[Content Analysis]
    E --> F[Key Points Extraction]
    F --> G[Information Hierarchy]
    C --> H[Visual Style Selection]
    H --> I[Layout Generation]
    I --> J[Visual Asset Matching]
    D --> K[Audience Analysis]
    K --> L[Purpose Identification]
    L --> M[Platform Optimization]
    G & J & M --> N[Integrated Visual Output]
    N --> O[User Feedback]
    O --> P[Continuous Learning]
    P -->|Improves| B
    P -->|Improves| C
    P -->|Improves| D
    classDef agent fill:#FF8000,stroke:#333,stroke-width:1px,color:white
    classDef process fill:#FFB366,stroke:#333,stroke-width:1px,color:black
    classDef output fill:#457B9D,stroke:#333,stroke-width:1px,color:white
    class A,N,O output
    class B,C,D agent
    class E,F,G,H,I,J,K,L,M,P process
This multi-agent system allows PageOn.ai to understand not just what your text says, but what it means and how it can best be visualized for maximum impact. The agents work in concert to create infographics that are not merely attractive but strategically designed to achieve your specific communication goals.
Integration Possibilities
The future of AI-powered visual communication will be increasingly integrated with other workflows and platforms:
Content Management Systems
Automatic infographic generation as part of content publishing workflows, with visuals that update dynamically as underlying data changes.
Learning Management Systems
Integration with educational platforms to automatically convert lesson content into engaging visual learning materials.
Business Intelligence Tools
Direct connection to data visualization platforms, creating narrative infographics from complex datasets with minimal human intervention.
Marketing Automation
Seamless incorporation into marketing workflows, automatically generating visual content for campaigns across multiple channels.
The Human-AI Creative Partnership
As these technologies evolve, the relationship between human creativity and AI assistance is being redefined:
Rather than replacing human creativity, AI tools like PageOn.ai are amplifying it—handling the technical execution while humans focus on strategic direction, emotional resonance, and creative vision. This partnership allows for unprecedented creative output while maintaining the human touch that makes communication truly effective.
Looking Ahead
As we move forward, the ability to instantly transform text into compelling visuals will become a standard capability across industries. Those who embrace and master these tools earliest will gain significant advantages in communication effectiveness, time efficiency, and audience engagement.
PageOn.ai is at the forefront of this transformation, continuously evolving its capabilities to stay ahead of emerging trends while maintaining the intuitive, accessible interface that makes professional-quality visual communication available to everyone.
Transform Your Visual Expressions with PageOn.ai
Join thousands of professionals who are creating stunning infographics in seconds without design skills. Turn your ideas into visual masterpieces today.
Start Creating with PageOn.ai TodayEmbracing the Visual Communication Revolution
Throughout this guide, I've explored how AI is transforming the way we communicate by making professional infographic creation accessible to everyone. The ability to convert text to stunning visuals in just 3 seconds represents more than just a technological achievement—it's a fundamental shift in how we share ideas, data, and stories.
As we've seen, PageOn.ai stands at the forefront of this revolution with its unparalleled speed, flexibility, and intelligent design capabilities. By leveraging create stunning infographics tools like PageOn.ai, you can dramatically enhance your communication effectiveness across all contexts—from business presentations to educational materials, marketing content to research publications.
The future of visual communication is bright, with AI continuing to evolve as a powerful creative partner that handles technical execution while amplifying human creativity and strategic vision. Those who embrace these tools early will gain significant advantages in engagement, comprehension, and communication efficiency.
I encourage you to explore PageOn.ai's capabilities and experience firsthand how it can transform your communication approach. Whether you're a seasoned designer looking to streamline your workflow or someone with no design experience seeking professional-quality visuals, the power to create compelling infographics in seconds is now at your fingertips.
You Might Also Like
Essential Open Source Tools for Local AI Development and Deployment | PageOn.ai
Discover the best open source tools for local AI development, from foundation models like Llama to deployment platforms like Ollama. Build your complete local AI stack with this visual guide.
Platform-Specific Infographic Formatting: Optimize for Social Media Success
Master platform-specific infographic formatting for Instagram, Pinterest, LinkedIn, Twitter & Facebook. Learn optimal dimensions, aspect ratios & design strategies for social media success.
Streamlined Visual Creation: The Essential Minimalist Creator's Toolkit That Actually Works
Discover how to build a truly minimalist creator's toolkit that delivers results. Learn to overcome creative bottlenecks and build sustainable workflows that boost productivity without sacrificing quality.
Beyond The Pitch: Visualizing Startup Traction Metrics That Win VC Funding
Discover the essential startup traction metrics that venture capitalists truly value. Learn how to visualize growth, efficiency, and revenue metrics to secure funding for your startup.