Transforming Complex Candlestick Patterns into Visual Clarity
A Beginner's Guide to Understanding Market Signals
Welcome to the fascinating world of candlestick pattern analysis. I've created this guide to help you transform complex market signals into intuitive visual understanding. Whether you're new to trading or looking to refine your technical analysis skills, this comprehensive breakdown will help you master the art of reading candlestick charts with confidence.
Introduction to Candlestick Charts
When I first encountered candlestick charts, I was immediately struck by how much more information they conveyed compared to traditional charts. These visual tools represent the universal language of financial markets, telling stories that numbers alone cannot express.

The Visual Language of Financial Markets
Candlestick charts originated in Japan over 300 years ago for rice trading but have become the preferred visual tool for modern traders. Unlike traditional line graphs to visualize trends, candlesticks show four crucial price points (open, high, low, close) in a single visual element, giving us immediate insight into market sentiment and momentum.
Psychological Advantage of Candlestick Visualization
I've found that the greatest advantage of candlestick charts lies in their ability to trigger pattern recognition in our brains. Our minds naturally process visual information more efficiently than raw data, allowing us to quickly identify potential market turning points and continuation signals.
Chart Type Information Density Comparison
The following chart shows the relative information density of different chart types:
With PageOn.ai, I can transform complex candlestick concepts into intuitive visuals that accelerate the learning process. The platform's ability to create interactive diagrams helps me understand pattern formation and market psychology much faster than traditional learning methods.
Anatomy of a Candlestick
Understanding the components of a candlestick is the foundation of pattern analysis. Each element tells us something specific about the battle between buyers and sellers during a given time period.
Candlestick Anatomy
This diagram breaks down the key elements of bullish and bearish candlesticks:
                        flowchart TD
                            subgraph Bullish["Bullish Candlestick (Green/White)"]
                                B_Open[Open Price] -->|Lower than close| B_Body
                                B_Close[Close Price] -->|Higher than open| B_Body
                                B_High[High Price] --- B_US[Upper Shadow/Wick]
                                B_Low[Low Price] --- B_LS[Lower Shadow/Wick]
                                B_Body[Real Body]
                            end
                            subgraph Bearish["Bearish Candlestick (Red/Black)"]
                                R_Open[Open Price] -->|Higher than close| R_Body
                                R_Close[Close Price] -->|Lower than open| R_Body
                                R_High[High Price] --- R_US[Upper Shadow/Wick]
                                R_Low[Low Price] --- R_LS[Lower Shadow/Wick]
                                R_Body[Real Body]
                            end
                            classDef bullish fill:#66BB6A,stroke:#388E3C,color:#fff
                            classDef bearish fill:#EF5350,stroke:#C62828,color:#fff
                            class B_Body,B_Open,B_Close,B_High,B_Low,B_US,B_LS bullish
                            class R_Body,R_Open,R_Close,R_High,R_Low,R_US,R_LS bearish
Decoding the Basic Elements
- Body: The rectangular part representing the range between opening and closing prices.
- Upper Shadow/Wick: The thin line extending above the body, showing the highest price reached.
- Lower Shadow/Wick: The thin line extending below the body, showing the lowest price reached.
Color Conventions Explained
While color schemes can vary between platforms, the most common conventions are:
- Green/White Candles: Bullish candles where the closing price is higher than the opening price.
- Red/Black Candles: Bearish candles where the closing price is lower than the opening price.
What Candlestick Elements Reveal
This chart illustrates what each component tells us about market psychology:
Using PageOn.ai's AI Blocks, I've created interactive candlestick anatomy diagrams that help me visualize how price movements form different patterns. These diagrams make it much easier to understand the psychological battle between buyers and sellers at each stage of candle formation.
Fundamental Candlestick Patterns for Beginners
Learning to recognize key candlestick patterns is essential for effective technical analysis. I've found that starting with the most common and reliable patterns helps build a solid foundation.
Single Candlestick Patterns
| Pattern | Appearance | Signal | Reliability |
|---|---|---|---|
| Doji | Open and close prices are nearly equal, creating a cross shape | Indecision, potential reversal |
|
| Hammer | Small body at the top, long lower shadow, little/no upper shadow | Bullish reversal at bottom of downtrend |
|
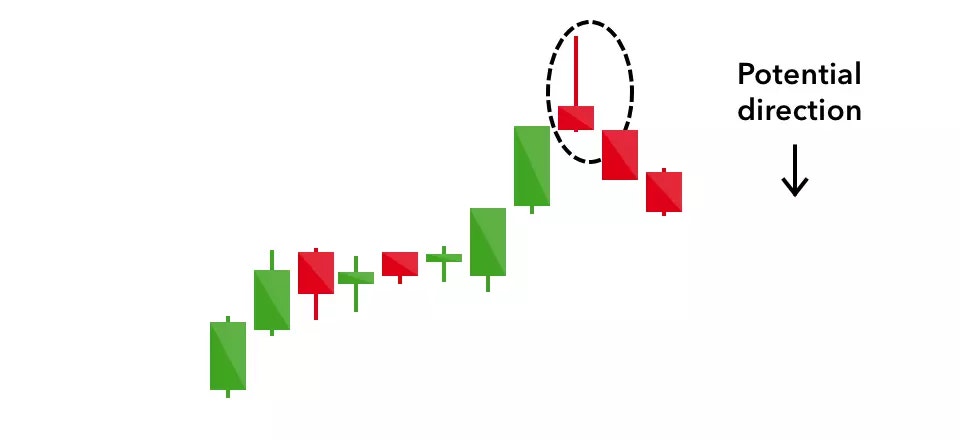
| Shooting Star | Small body at the bottom, long upper shadow, little/no lower shadow | Bearish reversal at top of uptrend |
|
Dual Candlestick Patterns
Bullish vs Bearish Engulfing Patterns
These dual candlestick patterns signal potential market reversals:
                        flowchart LR
                            subgraph BE["Bearish Engulfing"]
                                direction TB
                                BE1[Small Bullish Candle] --> BE2[Large Bearish Candle]
                                BE_Note["Appears at top of uptrend\nSignals potential reversal down"]
                            end
                            subgraph BUE["Bullish Engulfing"]
                                direction TB
                                BUE1[Small Bearish Candle] --> BUE2[Large Bullish Candle]
                                BUE_Note["Appears at bottom of downtrend\nSignals potential reversal up"]
                            end
                            classDef bullish fill:#66BB6A,stroke:#388E3C,color:#fff
                            classDef bearish fill:#EF5350,stroke:#C62828,color:#fff
                            classDef note fill:#FFF9C4,stroke:#FBC02D,color:#000
                            class BE1,BUE2 bullish
                            class BUE1,BE2 bearish
                            class BE_Note,BUE_Note note
Bearish engulfing patterns consist of two candlesticks where the second candle completely engulfs the body of the first. In a bearish engulfing pattern, we see a small bullish candle followed by a larger bearish candle that opens above the previous close and closes below the previous open, indicating a shift from bullish to bearish sentiment.
Similarly, bullish engulfing patterns show a small bearish candle followed by a larger bullish candle that opens below the previous open and closes above the previous close, suggesting strong buying pressure and a potential upward reversal.
Triple Candlestick Formations
| Pattern | Structure | Signal | Reliability |
|---|---|---|---|
| Morning Star | Bearish candle, small middle candle with gap down, bullish candle with gap up | Bullish reversal after downtrend |
|
| Evening Star | Bullish candle, small middle candle with gap up, bearish candle with gap down | Bearish reversal after uptrend |
|
| Three White Soldiers | Three consecutive bullish candles, each opening within previous body and closing higher | Strong bullish continuation |
|
With PageOn.ai's Deep Search feature, I can quickly find real-world examples of these patterns across different markets and timeframes. This helps me understand how these patterns behave in various contexts and improves my pattern recognition skills through practical examples rather than just theory.
Pattern Recognition Framework
Developing a systematic approach to identifying candlestick patterns has dramatically improved my trading accuracy. Here's the framework I use to consistently recognize and validate patterns.
Pattern Recognition Process
Follow this step-by-step approach to identify and confirm candlestick patterns:
                        flowchart TD
                            A[Identify Market Context] --> B[Recognize Potential Pattern]
                            B --> C{Pattern Confirmed?}
                            C -->|No| D[Look for Additional Signals]
                            D --> B
                            C -->|Yes| E[Check Volume Confirmation]
                            E --> F{Volume Supports Pattern?}
                            F -->|No| G[Lower Confidence Level]
                            F -->|Yes| H[Check Support/Resistance]
                            H --> I{Near Key Level?}
                            I -->|No| J[Standard Confidence]
                            I -->|Yes| K[Higher Confidence]
                            G --> L[Make Trading Decision]
                            J --> L
                            K --> L
                            classDef process fill:#FF8000,stroke:#E65100,color:#fff
                            classDef decision fill:#42A5F5,stroke:#1565C0,color:#fff
                            classDef action fill:#66BB6A,stroke:#2E7D32,color:#fff
                            classDef caution fill:#EF5350,stroke:#C62828,color:#fff
                            class A,B,D,E,H process
                            class C,F,I decision
                            class K,J,L action
                            class G caution
Common Pattern Identification Mistakes
- Ignoring the trend context: Patterns have different reliability depending on the prevailing trend.
- Forcing pattern recognition: Not every candlestick formation is a valid pattern.
- Missing confirmation signals: Relying solely on the pattern without seeking additional confirmation.
- Overtrading minor patterns: Giving equal weight to all patterns regardless of their historical reliability.
Pattern Confirmation Success Rates
This chart shows how different confirmation methods improve pattern reliability:
Building Your Pattern Cheat Sheet
Using PageOn.ai's visualization tools, I've created a custom candlestick pattern cheat sheet that helps me quickly identify patterns during live trading. The platform's ability to organize visual information makes it easy to reference patterns and their key characteristics at a glance.
My cheat sheet includes not just the pattern appearance but also typical volume profiles, optimal market contexts, and historical reliability metrics. This comprehensive approach to pattern recognition has significantly reduced my false signal rate.
Contextual Analysis: Beyond Individual Patterns
I've learned that candlestick patterns don't exist in isolation. Their reliability and significance depend heavily on the broader market context in which they appear.
Pattern Strength Based on Preceding Trends
The strength of a pattern is often directly related to the preceding trend. For example, a bullish engulfing pattern after a strong downtrend is typically more reliable than the same pattern appearing during a sideways consolidation. This is because the pattern represents a significant shift in market psychology after a sustained move in one direction.
Volume as Pattern Confirmation
Pattern Reliability with Volume Confirmation
How volume affects the reliability of different candlestick patterns:
Volume provides crucial confirmation for candlestick patterns. High volume during pattern formation suggests stronger conviction behind the price movement, while low volume may indicate a lack of participation and potentially weaker signal. I always check volume when evaluating the strength of a pattern.
Support and Resistance Integration
Pattern Strength at Key Levels
How support and resistance levels enhance pattern significance:
                        flowchart TD
                            A[Identify Key Support/Resistance Level] --> B[Spot Candlestick Pattern Near Level]
                            B --> C{Pattern Type?}
                            C -->|Reversal Pattern| D[Potential Strong Signal]
                            C -->|Continuation Pattern| E[Potential Breakout/Breakdown]
                            D --> F{Volume Confirmation?}
                            E --> F
                            F -->|Yes| G[High Probability Setup]
                            F -->|No| H[Moderate Probability Setup]
                            G --> I[Set Entry, Stop Loss, Take Profit]
                            H --> J[Consider Additional Confirmation]
                            J --> I
                            classDef primary fill:#FF8000,stroke:#E65100,color:#fff
                            classDef secondary fill:#42A5F5,stroke:#1565C0,color:#fff
                            classDef success fill:#66BB6A,stroke:#2E7D32,color:#fff
                            classDef warning fill:#FFA726,stroke:#EF6C00,color:#fff
                            class A,B primary
                            class C,F secondary
                            class D,E,G success
                            class H,J warning
                            class I primary
When candlestick patterns form near key support or resistance levels, their significance increases substantially. These levels represent areas where buyers and sellers have historically shown strong interest, adding another layer of confirmation to the pattern.
Using PageOn.ai, I've created comprehensive multi-factor analysis dashboards that combine candlestick patterns with volume indicators, trend analysis, and support/resistance levels. These integrated visualizations help me quickly assess the overall strength of a trading setup rather than relying on isolated signals.
Practical Application Strategies
Applying candlestick analysis effectively requires understanding how patterns behave across different time frames and markets. Here's how I adapt my approach to maximize success.
Time Frame Considerations
Pattern Reliability Across Time Frames
This chart compares pattern reliability across different time intervals:
I've found that candlestick patterns generally become more reliable as the time frame increases. Patterns on daily charts tend to have more significance than those on 5-minute charts because they represent the consensus of more market participants over a longer period. However, shorter time frames can be useful for timing entries once a setup is identified on higher time frames.
Market-Specific Pattern Reliability

Different markets respond to candlestick patterns in unique ways. In my experience, traditional markets like stocks and forex tend to respect classical patterns more consistently than newer markets like cryptocurrencies, which can be more volatile and less predictable. Understanding these differences helps me adjust my expectations and strategy accordingly.
Entry and Exit Strategies
| Pattern | Entry Strategy | Stop Loss Placement | Take Profit Approach |
|---|---|---|---|
| Bullish Engulfing | Enter above the high of engulfing candle | Below the low of the engulfing pattern | Next resistance or 1:2 risk-reward ratio |
| Evening Star | Enter below the low of third candle | Above the high of the middle candle | Next support or 1:3 risk-reward ratio |
| Hammer | Enter above the high of hammer candle | Below the low of the hammer's shadow | Previous resistance turned support |
Using PageOn.ai's structural tools, I've created decision trees for candlestick trading that help me quickly determine optimal entry and exit points based on pattern type, market conditions, and risk tolerance. These visual guides have streamlined my decision-making process and helped maintain consistency in my trading approach.
Building Your Candlestick Trading System
Creating a complete trading system around candlestick patterns requires integrating multiple components into a cohesive whole. Here's how I've built my approach.
Combining Patterns with Technical Indicators
Integrated Trading System Framework
How candlestick patterns work with other technical tools:
                        flowchart TD
                            A[Market Analysis] --> B[Trend Identification]
                            B --> C[Bullish Trend]
                            B --> D[Bearish Trend]
                            B --> E[Sideways/Ranging]
                            C --> F[Look for Bullish Continuation Patterns]
                            D --> G[Look for Bearish Continuation Patterns]
                            E --> H[Look for Breakout Patterns]
                            F & G & H --> I[Identify Candlestick Pattern]
                            I --> J[Confirm with Indicators]
                            J --> K[Moving Averages]
                            J --> L[RSI/Stochastic]
                            J --> M[MACD]
                            J --> N[Volume Profile]
                            K & L & M & N --> O{Confirmation?}
                            O -->|Yes| P[Set Entry, Stop Loss, Take Profit]
                            O -->|No| Q[Skip Trade]
                            P --> R[Execute Trade]
                            R --> S[Monitor and Manage]
                            classDef primary fill:#FF8000,stroke:#E65100,color:#fff
                            classDef secondary fill:#42A5F5,stroke:#1565C0,color:#fff
                            classDef tertiary fill:#66BB6A,stroke:#2E7D32,color:#fff
                            classDef decision fill:#FFA726,stroke:#EF6C00,color:#fff
                            class A,I,J primary
                            class B,C,D,E,K,L,M,N secondary
                            class F,G,H,P,R,S tertiary
                            class O decision
                            class Q tertiary
I've found that combining candlestick patterns with technical indicators creates a more robust trading system than using either approach alone. For example, a bullish engulfing pattern that forms near a support level and coincides with an oversold RSI reading provides multiple layers of confirmation, increasing the probability of a successful trade.
Backtesting Methodology

Backtesting is essential for validating candlestick strategies before risking real capital. I use data visualization charts to track key performance metrics like win rate, profit factor, and maximum drawdown for different patterns across various market conditions. This helps me identify which patterns are most reliable for my trading style and risk tolerance.
Risk Management Principles
Risk-Adjusted Returns by Pattern Type
This chart compares risk-adjusted performance of different pattern strategies:
Effective risk management is crucial when trading with candlestick patterns. I limit my risk per trade to 1-2% of my total capital and ensure that my potential reward is at least twice my risk. This approach helps protect my capital during inevitable losing streaks while allowing my winning trades to outpace my losses over time.
Using PageOn.ai's integrated workflow visualization tools, I've mapped out my complete trading system, from initial market analysis to trade execution and management. Having this visual representation helps me maintain discipline and consistency in my approach, even during challenging market conditions.
From Analysis to Action: Implementation Guide
Putting candlestick analysis into practice requires the right tools and systems. Here's how I've implemented my approach for consistent results.
Setting Up Your Charting Platform
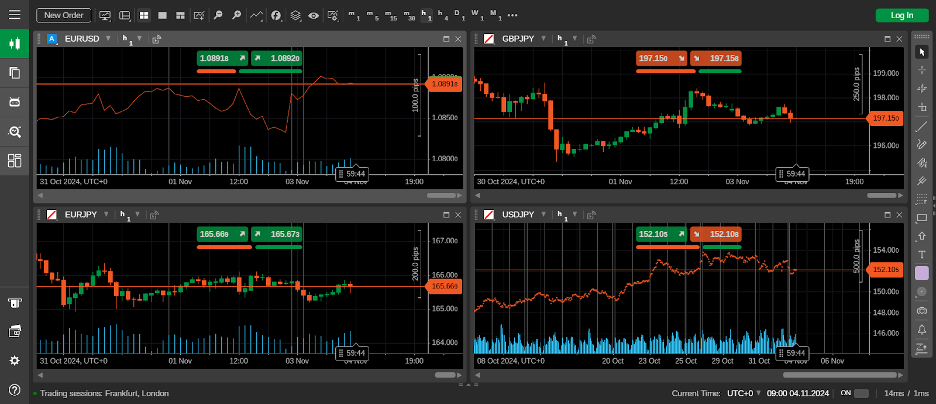
A well-organized charting platform is essential for effective pattern recognition. I customize my charts with clean layouts that highlight candlestick formations while including only the most relevant indicators to avoid information overload. Key elements include:
- Multiple timeframe views: To confirm patterns across different intervals
- Volume indicators: For pattern confirmation
- Moving averages: To identify trend direction and potential support/resistance
- Clear drawing tools: For marking support/resistance levels and trend lines
- Pattern recognition indicators: To help spot potential setups
Creating a Personal Pattern Library
I've developed a personal library of candlestick patterns that work best for my trading style and the markets I focus on. This library includes screenshots of successful patterns from past trades, along with notes on the context in which they appeared and the outcomes they produced.
Using AI powered growth charts, I track my improvement in pattern recognition accuracy over time. This helps me identify which patterns I'm most proficient at trading and where I need more practice.
Developing a Trading Journal Template
Candlestick Trading Journal Structure
An effective trading journal template for candlestick traders:
                        flowchart TD
                            A[Trade Entry] --> B[Pre-Trade Analysis]
                            A --> C[Trade Details]
                            A --> D[Post-Trade Analysis]
                            B --> B1[Market Context]
                            B --> B2[Pattern Identified]
                            B --> B3[Confirmation Signals]
                            B --> B4[Risk Assessment]
                            C --> C1[Entry Date/Time]
                            C --> C2[Position Size]
                            C --> C3[Entry Price]
                            C --> C4[Stop Loss]
                            C --> C5[Target Price]
                            D --> D1[Exit Date/Time]
                            D --> D2[Exit Price]
                            D --> D3[P/L Result]
                            D --> D4[Pattern Performance]
                            D --> D5[Lessons Learned]
                            classDef primary fill:#FF8000,stroke:#E65100,color:#fff
                            classDef secondary fill:#42A5F5,stroke:#1565C0,color:#fff
                            classDef details fill:#66BB6A,stroke:#2E7D32,color:#fff
                            class A primary
                            class B,C,D secondary
                            class B1,B2,B3,B4,C1,C2,C3,C4,C5,D1,D2,D3,D4,D5 details
Maintaining a detailed trading journal has been transformative for my candlestick trading. By documenting each trade and reviewing patterns over time, I've identified my strengths and weaknesses, allowing me to refine my approach continuously.
Using PageOn.ai to transform my trading ideas into actionable visual workflows has streamlined my entire process. I can now quickly create decision trees, trading checklists, and pattern recognition guides that help me stay focused and consistent in my approach.
Learning Curve for Candlestick Mastery
The progression of skill development in candlestick pattern trading:
Transform Your Candlestick Pattern Analysis with PageOn.ai
Create stunning visual representations of candlestick patterns, build interactive decision trees, and design comprehensive trading systems that turn complex market data into clear, actionable insights.
Start Creating with PageOn.ai TodayConclusion: Your Journey to Candlestick Mastery
Mastering candlestick pattern analysis is a journey that combines technical knowledge with practical experience. By understanding the anatomy of candlesticks, recognizing key patterns, and interpreting them within their market context, you can develop a powerful skill that will serve your trading or investing career for years to come.
Throughout this guide, I've shared how I use horizontal bar charts and other visualization tools to make sense of complex market data. With tools like AI-powered bar chart generators, you can transform your own analysis into clear, compelling visuals that enhance your decision-making process.
Remember that consistency and discipline are just as important as pattern recognition skills. By developing a systematic approach, maintaining a detailed trading journal, and continuously refining your strategy, you'll be well on your way to becoming proficient in the art of candlestick pattern analysis.
I encourage you to use the visualization techniques and frameworks outlined in this guide to develop your own candlestick trading system. With practice and patience, you'll find that what once seemed like complex market signals will become intuitive visual cues that guide your trading decisions with confidence.
You Might Also Like
Creating Interactive and Animated Infographics for Enhanced User Engagement
Discover how to transform data into captivating interactive stories through animated infographics. Learn best practices, technical approaches, and tools for creating engaging visual experiences.
Visualizing the CIA Triad: A Modern Framework for Cybersecurity Success
Discover how the CIA triad (Confidentiality, Integrity, Availability) forms the foundation of modern cybersecurity. Learn implementation strategies and visualization techniques for security success.
Strategic Infographic Planning: Transform Complex Ideas into Visual Narratives | PageOn.ai
Master strategic content planning for infographics that tell clear visual stories. Learn frameworks, data visualization strategies, and design elements that transform complex ideas into engaging narratives.
AI-Powered Coding Assistants: Integrating Language Models into Development Workflows
Discover how AI coding assistants transform development workflows by integrating language models to create visual clarity in complex programming environments.