Transforming Growth Metrics: How CAGR Visualization Unlocks Hidden Market Potential
Understanding CAGR as a Strategic Market Indicator
I've spent years analyzing market growth patterns, and I've found that Compound Annual Growth Rate (CAGR) is one of the most powerful metrics for uncovering genuine market opportunities. In this comprehensive guide, I'll show you how to transform raw CAGR data into compelling visual narratives that reveal hidden market potential and convince stakeholders of your vision.
Understanding CAGR as a Strategic Market Indicator
When I'm evaluating market opportunities, I've found that Compound Annual Growth Rate (CAGR) provides insights that other metrics simply can't match. Let me explain why it's so valuable and how we can leverage it effectively.
Definition and Calculation
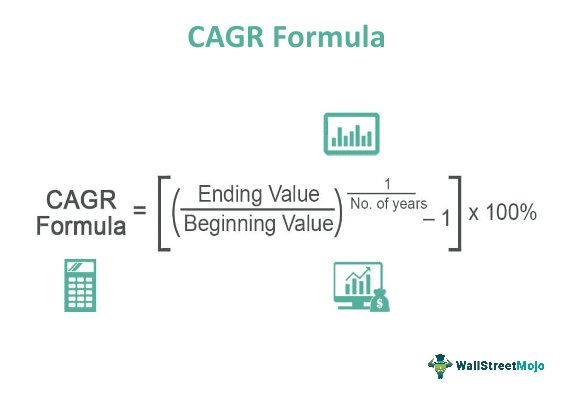
CAGR represents the mean annual growth rate of an investment over a specified period longer than one year. The formula looks deceptively simple:
CAGR = (Ending Value / Beginning Value)^(1/n) - 1
Where n = number of years
CAGR vs. Other Growth Metrics
Unlike year-over-year (YOY) growth or simple average growth rates, CAGR accounts for the compounding effect that occurs over time. This makes it particularly valuable for:
- Smoothing out volatility in growth patterns
- Enabling fair comparisons between investments of different durations
- Providing a single growth figure that accounts for compounding effects
- Creating more accurate long-term projections
Limitations and Common Misconceptions
While CAGR is powerful, I've seen many professionals fall into these common traps:
- Assuming past CAGR will continue unchanged into the future
- Ignoring the volatility that may exist within the measurement period
- Failing to consider market saturation points that may limit future growth
- Not accounting for inflation or other economic factors
When I'm working with complex CAGR data, I rely on PageOn.ai to transform these abstract formulas into intuitive visual models. This helps me quickly identify trends that might otherwise remain hidden in spreadsheets and formulas.
Identifying High-Growth Industries Through CAGR Analysis
I've developed several techniques for spotting emerging market opportunities by analyzing historical CAGR data. Here's my approach to uncovering hidden gems in the market landscape.
Techniques for Spotting Emerging Opportunities
When I'm hunting for the next big market opportunity, I look for these CAGR patterns:
Accelerating CAGR
Industries where the CAGR itself is increasing over sequential periods often indicate emerging opportunities.
Cross-Industry Convergence
When two industries with strong CAGRs begin to overlap, the intersection often creates explosive growth potential.
Enabling Technology Inflection
Industries benefiting from new enabling technologies often show sudden CAGR increases.
Geographic CAGR Disparities
Significant differences in regional CAGRs can highlight untapped expansion opportunities.
Technology Industry Insights Through CAGR
The technology sector offers some of the most compelling CAGR stories. My analysis of technology industry insights reveals several sub-sectors with remarkable growth trajectories:
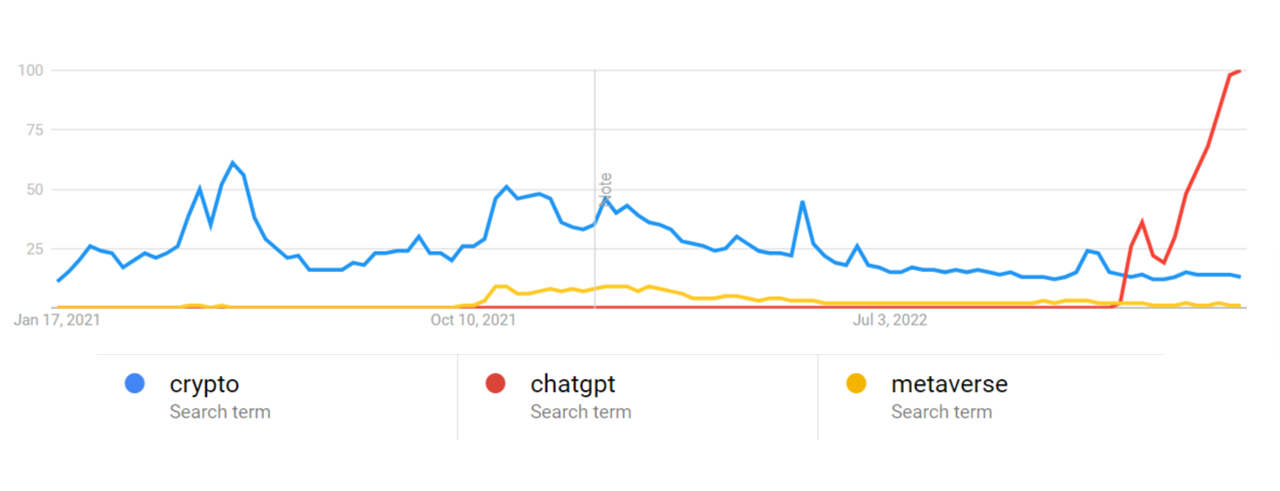
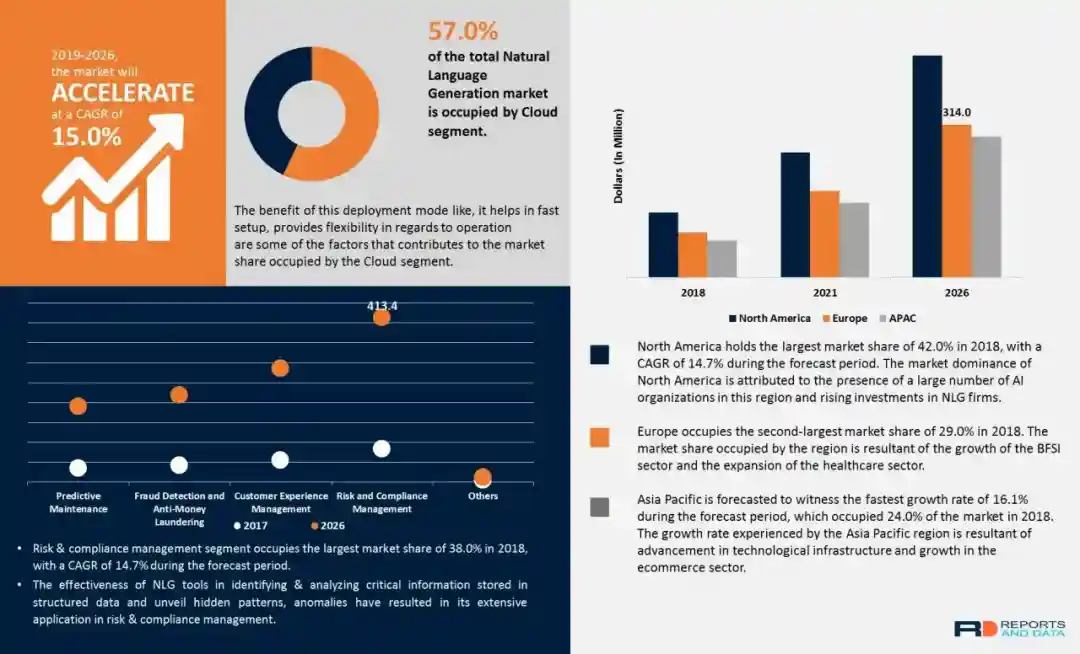
Case Study: Generative AI Market
One of the most compelling examples I've studied is how early CAGR analysis identified investment opportunities in the generative AI market before it reached mainstream awareness.
Generative AI Market Case Study
- Early indicators (2018-2020): Initial CAGR projections of 27-32%
- Mid-adoption phase (2021-2022): Revised CAGR projections of 40-45%
- Current projections (2023-2030): CAGR estimates of 35-42%
- Key inflection point: Release of foundation models that dramatically expanded use cases
Using PageOn.ai for CAGR Analysis
I've found PageOn.ai's Deep Search functionality invaluable for automatically integrating updated CAGR data from credible sources. This keeps my market analyses current without requiring constant manual updates.
Comparative CAGR Analysis
When I'm looking to identify micro-trends, I often perform comparative CAGR analysis across industry segments:
flowchart TD
    A[Industry CAGR Analysis] --> B[Segment Breakdown]
    B --> C[Sub-Segment 1]
    B --> D[Sub-Segment 2]
    B --> E[Sub-Segment 3]
    C --> F[Micro-Trend Identification]
    D --> F
    E --> F
    F --> G[Opportunity Sizing]
    F --> H[Risk Assessment]
    G --> I[Market Entry Strategy]
    H --> I
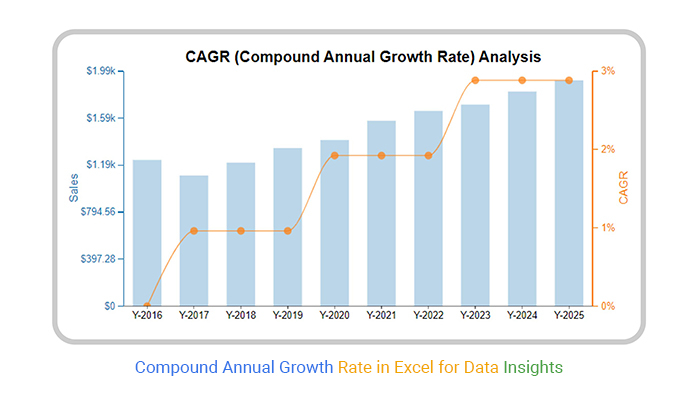
Visualizing CAGR Data for Maximum Impact
In my experience, the difference between ignored data and actionable insights often comes down to visualization. Here's how I transform raw CAGR percentages into compelling visual narratives.
Transforming Raw CAGR Data
When I'm presented with raw CAGR figures, I immediately look for ways to contextualize them visually:
Creating Dynamic Growth Projections
I use PageOn.ai's AI Blocks to create dynamic growth curve projections that help stakeholders visualize future market states:
Highlighting Inflection Points
I've found that identifying and visualizing inflection points in growth trajectories is critical for timing market entry:
flowchart TD
    A[Market Lifecycle Analysis] --> B{Inflection Point Identification}
    B --> C[Early Growth Phase]
    B --> D[Rapid Acceleration Phase]
    B --> E[Maturity Approach Phase]
    C --> F[5-15% CAGR]
    D --> G[25-40%+ CAGR]
    E --> H[Declining CAGR]
    F --> I[Market Education Focus]
    G --> J[Rapid Scaling Focus]
    H --> K[Consolidation Focus]
    style D fill:#FF8000,stroke:#FF8000,color:white
    style G fill:#FF8000,stroke:#FF8000,color:white
    style J fill:#FF8000,stroke:#FF8000,color:white
Designing Comparative CAGR Visualizations
When I need to compare multiple industries, I create visualizations that make the differences immediately apparent:
Custom CAGR Templates with PageOn.ai
One of my favorite features of PageOn.ai is the ability to generate custom CAGR visualization templates that update automatically when new data becomes available. This ensures my market analyses are always current without requiring manual rework.
Building a Comprehensive Total Addressable Market Model with CAGR
I've found that integrating CAGR data into total addressable market visualization creates a powerful framework for opportunity assessment. Here's my approach to building these models.
Integrating CAGR into TAM, SAM, and SOM
When building market models, I always integrate CAGR at each level of market definition:
flowchart TD
    A[Total Addressable Market TAM] --> B[Serviceable Addressable Market SAM]
    B --> C[Serviceable Obtainable Market SOM]
    A --> D[TAM CAGR: 12%]
    B --> E[SAM CAGR: 18%]
    C --> F[SOM CAGR: 25%]
    D --> G[TAM Year 5: $85B]
    E --> H[SAM Year 5: $32B]
    F --> I[SOM Year 5: $4.7B]
Multi-Year Market Opportunity Forecasts
I develop detailed multi-year forecasts based on compounded growth to understand how market opportunities evolve:
Visualizing Market Penetration Potential
I use CAGR-based projections to create visual models of market penetration potential over time:
| Year | Market Size ($B) | Penetration Rate | Revenue Potential ($M) | Market Share |
|---|---|---|---|---|
| 2023 | 14.2 | 0.5% | 71 | 0.8% |
| 2024 | 17.0 | 1.2% | 204 | 1.5% |
| 2025 | 20.4 | 2.1% | 428 | 2.4% |
| 2026 | 24.5 | 3.2% | 784 | 3.6% |
| 2027 | 29.4 | 4.5% | 1,323 | 5.0% |
PageOn.ai's Vibe Creation for Market Sizing
I leverage PageOn.ai's Vibe Creation feature to transform complex market sizing data into clear visual frameworks that make the opportunity immediately apparent to stakeholders.

Regional CAGR Variations
I always incorporate regional CAGR variations into global market assessments to identify geographic expansion opportunities:
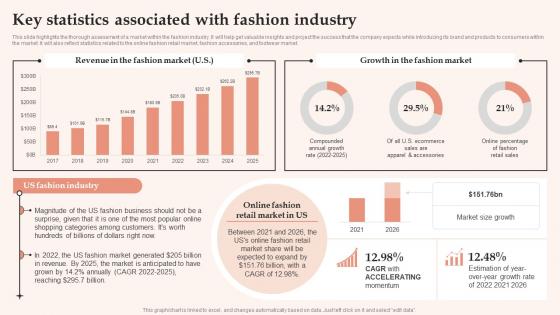
Leveraging Market Research Reports to Validate CAGR Projections
I always validate my CAGR projections against multiple market research reports to ensure accuracy. Here's my methodology for extracting maximum value from these resources.
Identifying Reliable Data Sources
When evaluating industry-specific CAGR figures, I look for these characteristics in reliable sources:
Methodology Transparency
Clear explanation of data collection methods, sample sizes, and calculation approaches.
Recency of Data
Reports published within the last 6-12 months to capture current market conditions.
Author Credentials
Reports from established research firms with domain expertise in the specific industry.
Consistency Check
CAGR figures that are within a reasonable range of other reputable sources.
Extracting and Normalizing CAGR Data
I've developed techniques for extracting and normalizing CAGR data from diverse research reports:
flowchart TD
    A[Raw CAGR Data Collection] --> B[Normalization Process]
    B --> C[Timeframe Alignment]
    B --> D[Segmentation Standardization]
    B --> E[Currency Conversion]
    C --> F[Normalized CAGR Dataset]
    D --> F
    E --> F
    F --> G[Cross-Source Validation]
    G --> H[Confidence Level Assignment]
    H --> I[Final CAGR Projection]
Visual Comparison of CAGR Projections
I use PageOn.ai to visually compare CAGR projections from multiple analyst sources:
Accounting for Methodological Differences
I always consider these methodological differences when comparing CAGR calculations across reports:
- Different market definitions and segment boundaries
- Varying time horizons for projections
- Inclusion or exclusion of specific sub-segments
- Treatment of currency exchange rates in global markets
- Different base years for calculations
Creating Confidence Intervals
I create confidence intervals for CAGR projections using multiple data sources:

Presenting CAGR Data to Stakeholders for Maximum Persuasion
I've found that even the most compelling CAGR data can fall flat without the right presentation approach. Here's how I make growth metrics truly persuasive.
Storytelling with CAGR Figures
I transform dry CAGR percentages into compelling narratives using these storytelling techniques:
Compound Effect Visualization
Show how small CAGR differences compound dramatically over time using clear visual metaphors.
Historical Parallels
Compare current CAGR projections to historical success stories in similar markets.
Milestone Mapping
Convert abstract growth rates into concrete business milestones and timelines.
Opportunity Cost Framing
Illustrate the cost of delaying entry into high-CAGR markets with time-based scenarios.
Designing Executive-Ready Dashboards
When I create dashboards for executives, I focus on these key elements:

Interactive CAGR Visualization Scenarios
I use PageOn.ai's AI Blocks to create interactive CAGR visualization scenarios that allow stakeholders to explore different growth assumptions:
CAGR in Pitch Decks
I incorporate CAGR visualizations into pitch decks and investor presentations using these best practices:
- Lead with the most impressive, defensible CAGR figure relevant to your specific opportunity
- Show the compounding effect visually rather than just stating percentages
- Include credibility markers (data sources, methodology notes) in small text
- Contextualize your CAGR against industry averages or competitor benchmarks
- Connect CAGR directly to revenue/valuation implications for investors
Addressing CAGR Skepticism
When presenting aggressive CAGR projections, I proactively address skepticism with these approaches:
flowchart TD
    A[CAGR Credibility Framework] --> B[Historical Precedents]
    A --> C[Multiple Source Validation]
    A --> D[Sensitivity Analysis]
    A --> E[Growth Driver Mapping]
    B --> F[Stakeholder Confidence]
    C --> F
    D --> F
    E --> F
    F --> G[Investment Decision]
Advanced CAGR Analysis: Beyond Basic Growth Metrics
For truly comprehensive market opportunity assessment, I go beyond basic CAGR figures to incorporate additional factors that influence growth trajectories.
Incorporating Risk Factors
I integrate these risk factors and economic indicators into my CAGR projections:
Macroeconomic Factors
- GDP growth projections
- Interest rate forecasts
- Inflation expectations
Industry-Specific Risks
- Regulatory changes
- Technological disruption
- Supply chain constraints
Market Dynamics
- Competitive intensity
- Pricing pressure
- Customer adoption cycles
Developing Sensitivity Analyses
I develop detailed sensitivity analyses for CAGR-based market opportunity assessments:
Using Tools for Industry Insights
I leverage specialized tools for industry insights to enhance CAGR interpretation and identify nuanced growth patterns.
Competitive Positioning Matrices
I create competitive positioning matrices based on CAGR performance to identify market leaders and emerging challengers:
Multi-Variable CAGR Analysis with PageOn.ai
PageOn.ai transforms complex multi-variable CAGR analyses into clear decision frameworks that make it easy to identify optimal market entry strategies.
Transform Your Visual Expressions with PageOn.ai
Ready to turn complex CAGR data into compelling visual narratives that drive decisions? PageOn.ai's powerful visualization tools make it easy to create professional-grade market opportunity analyses that convince stakeholders and reveal hidden potential.
Start Creating with PageOn.ai TodayUnlocking Market Potential Through CAGR Visualization
Throughout this guide, I've shared my approach to transforming raw CAGR data into compelling visual narratives that reveal hidden market opportunities. The power of CAGR analysis lies not just in the numbers themselves, but in how effectively they're visualized and communicated to stakeholders.
By leveraging PageOn.ai's visualization capabilities, you can:
- Transform complex growth metrics into intuitive visual models
- Create dynamic projections that adapt to changing market conditions
- Build comprehensive TAM models that incorporate CAGR at every level
- Design executive-ready dashboards that showcase market opportunity
- Develop interactive scenarios that allow stakeholders to explore different assumptions
In today's data-rich business environment, the ability to effectively visualize CAGR and other growth metrics is a competitive advantage. With PageOn.ai, you can turn abstract percentages into compelling visual narratives that drive strategic decisions and unlock hidden market potential.
You Might Also Like
Transform Any Content into Professional Slides: The Ultimate Conversion Guide
Learn expert techniques for converting documents, presentations, and visual content into professional slides with this comprehensive guide to content format transformation.
Transforming Value Propositions into Visual Clarity: A Modern Approach | PageOn.ai
Discover how to create crystal clear audience value propositions through visual expression. Learn techniques, frameworks, and tools to transform complex ideas into compelling visual narratives.
Mastering FOMO Psychology: Creating Irresistible Business Pitch Strategies | PageOn.ai
Learn how to leverage FOMO psychology in your business pitches to drive urgent action. Discover proven strategies for creating authentic scarcity, exclusivity, and urgency that converts.
From Slides to Stories: Transform Presentations into Purpose-Driven Visual Experiences
Discover how to move beyond traditional PowerPoint presentations to create purpose-driven visual experiences that engage audiences, drive action, and leave lasting impact.