The Ultimate Guide to Free Diagramming Tools
Creating Professional Visuals Without Breaking the Bank
I've spent years exploring the world of visual communication tools, and I'm excited to share everything I've learned about creating stunning diagrams without spending a dime. In this comprehensive guide, we'll explore the best free diagramming solutions available today and how they can transform your visual communication.
Understanding the Diagramming Landscape
When I first started exploring the world of visual communication, I was overwhelmed by the sheer variety of diagramming tools available. Today, the ecosystem is even more diverse, with solutions ranging from simple drag-and-drop interfaces to sophisticated platforms with AI capabilities.

I've found that the democratization of design tools has been revolutionary for professionals across industries. No longer do you need expensive software licenses to create professional-quality visuals. Free diagramming tools have made visual communication accessible to everyone from students to entrepreneurs to corporate teams.
Categories of Free Diagramming Tools
Web-Based Solutions
Cloud-accessible tools that require no installation and often offer real-time collaboration features. Examples include Diagrams.net (formerly Draw.io), Canva, and Lucidchart's free tier.
Desktop Applications
Installed software that typically offers more robust features and offline capabilities. Notable examples include Dia, yEd Graph Editor, and LibreOffice Draw.
Mobile Applications
On-the-go solutions optimized for touch interfaces, allowing diagram creation from tablets and smartphones. Examples include Concepts, Grafio 3, and SimpleMind.
In my experience, understanding which tool category best suits your needs is the first step toward effective visual communication. Each has its own strengths and limitations that I'll explore throughout this guide.
The importance of selecting the right diagram type for your specific communication needs cannot be overstated. When I'm working with technical documentation, I often need different visualization approaches than when I'm mapping out business processes or brainstorming new ideas. Understanding the various types of diagrams available and their specific purposes helps ensure your message is conveyed clearly and effectively.
Top Free Diagramming Tools Worth Exploring
After years of testing dozens of free diagramming tools, I've compiled what I consider to be the most valuable options available today. Each offers unique strengths that might make it the perfect fit for your specific needs.
Popularity of Free Diagramming Tools in 2023
Based on my research and community feedback, here's how the top free diagramming tools compare in terms of user adoption:
Open-Source Champions
In my exploration of open-source diagramming tools, I've found several standouts that rival commercial alternatives:
- Diagrams.net (formerly Draw.io): My go-to recommendation for most users due to its extensive shape libraries, integration options, and intuitive interface.
- Dia: Excellent for technical diagrams with specialized shape sets for network diagrams, circuit designs, and UML.
- Pencil Project: Perfect for UI/UX mockups with built-in stencils for various platforms.
Cloud-Based Solutions
When collaboration is a priority, I turn to these web-based options:
- Canva: While primarily known for graphic design, its diagramming capabilities are surprisingly robust for business visuals.
- Lucidchart (Free Tier): Limited but powerful for basic diagrams with excellent real-time collaboration.
- Miro (Free Plan): Outstanding for collaborative brainstorming and visual thinking.
Desktop Powerhouses
For offline work with more processing power, I recommend:
- yEd Graph Editor: Exceptional for automatically laying out complex networks and hierarchies.
- LibreOffice Draw: Versatile for general-purpose diagrams with the advantage of integration with a complete office suite.
Mobile-Friendly Options
When I need to create or edit diagrams on the go:
- Concepts: Excellent for free-form diagrams with an infinite canvas.
- SimpleMind Free: Focused on mind mapping with an intuitive touch interface.
While these traditional tools have served me well, I've been increasingly impressed by the emergence of AI-powered solutions that can transform text into professional diagrams. These tools are changing how we approach visualization by allowing us to describe what we want in natural language rather than manually constructing every element.
Tool Selection Decision Flow
I use this decision framework when choosing between free diagramming tools:
flowchart TD
    A[Start Selection] --> B{Need Collaboration?}
    B -->|Yes| C{Internet Connection?}
    B -->|No| D{Technical Diagrams?}
    C -->|Reliable| E[Cloud Tools]
    C -->|Limited| F[Desktop with Cloud Sync]
    D -->|Yes| G[Specialized Desktop Tools]
    D -->|No| H{Mobile Creation?}
    H -->|Yes| I[Mobile Apps]
    H -->|No| J[General Desktop Tools]
    E --> K[Diagrams.net or Lucidchart]
    F --> L[yEd with Manual Sync]
    G --> M[Dia or yEd]
    I --> N[Concepts or SimpleMind]
    J --> O[LibreOffice Draw]
Essential Features in Free Diagramming Software
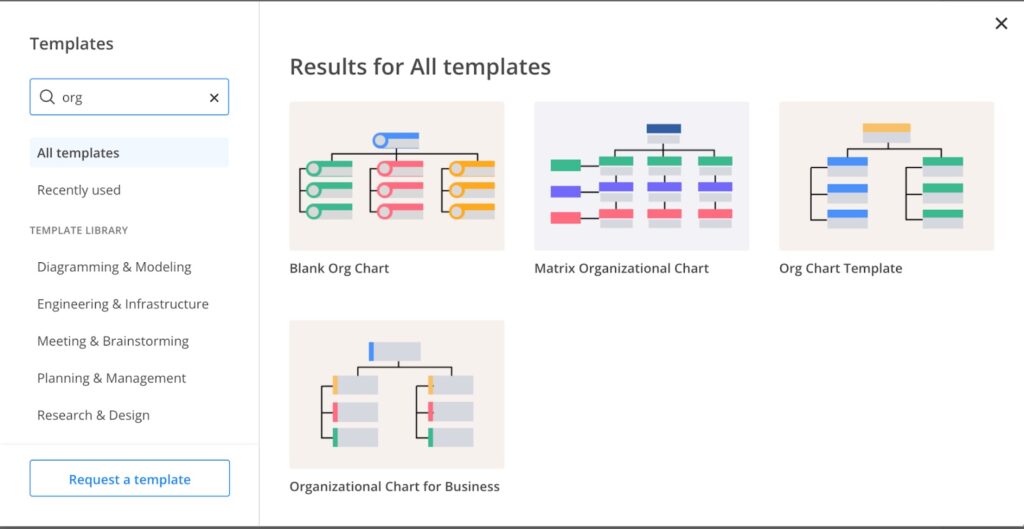
Not all free diagramming tools are created equal. Through my experience, I've identified key features that separate truly useful free tools from those with too many limitations.
Must-Have Functionality
| Feature | Why It Matters | Best Free Tools |
|---|---|---|
| Extensive Shape Libraries | Provides ready-made elements for specific diagram types | Diagrams.net, yEd |
| Export Options | Ensures diagrams can be shared in various formats | Diagrams.net, LibreOffice Draw |
| Connector Tools | Maintains connections when moving elements | yEd, Lucidchart |
| Templates | Accelerates creation of common diagram types | Canva, Lucidchart |
| Auto-Layout Options | Organizes complex diagrams automatically | yEd, Diagrams.net |
Template Libraries
In my workflow, I've found that template libraries dramatically accelerate the diagram creation process. The best free tools offer extensive template collections that provide starting points for common diagram types.
Template Availability Comparison
How the top free tools compare in terms of template variety:
Export Options
I've learned that the ability to export diagrams in various formats is crucial for sharing and presenting your work. The most versatile free tools offer multiple export options:
- Vector formats (SVG): Essential for scalable diagrams that can be resized without losing quality
- Raster formats (PNG, JPG): Important for web use and embedding in documents
- Document formats (PDF): Critical for professional sharing and printing
- Editable formats: Allows others to modify your diagrams in different tools
Collaboration Features
Working with teams has taught me the value of collaboration features, even in free tools. Look for:
- Sharing options: The ability to share view-only or editable links
- Comment functionality: Allows feedback without direct edits
- Version history: Tracks changes and allows reverting to previous versions
- Real-time collaboration: Multiple users editing simultaneously (rare in free tools but available in some)
Customization Capabilities
I've found that the ability to customize diagrams is essential for creating unique visual identities. The best free tools offer:
- Custom color palettes: Allows alignment with brand colors
- Font selection: Important for maintaining brand identity
- Custom shapes: The ability to create or import unique elements
- Style presets: Saves time when creating multiple diagrams with consistent styling
Creating Technical Diagrams Without a Budget
Technical diagrams often require specialized tools, but I've discovered effective ways to create professional-quality technical visualizations using completely free solutions.

Flowcharts and Process Diagrams
For flowcharts and process diagrams, I've found these free tools particularly effective:
Diagrams.net (Draw.io)
My primary recommendation for flowcharts due to its extensive shape libraries and intuitive connector tools.
Pro Tip: Use the "Arrange" feature to automatically align and distribute elements for clean, professional-looking flowcharts.
Pencil Project
Excellent for wireframe-style process flows with its clean, minimalist aesthetic.
Pro Tip: Use the stencil collection for flowcharting that includes decision diamonds, process rectangles, and various connector styles.
Simple Decision Process Flowchart Example
Here's a basic flowchart that can be created in any free diagramming tool:
flowchart TD
    A[Start Process] --> B{Decision Point}
    B -->|Option 1| C[Process Step 1]
    B -->|Option 2| D[Process Step 2]
    C --> E[Intermediate Result]
    D --> E
    E --> F{Quality Check}
    F -->|Pass| G[Final Output]
    F -->|Fail| H[Revise]
    H --> E
Network Diagrams
Creating complex network diagrams without premium software can be challenging, but I've had success with these approaches:
- yEd Graph Editor: Exceptional for automatic layout of complex networks with many nodes and connections
- Dia: Includes specialized network shape libraries for various protocols and equipment
- Diagrams.net: Offers comprehensive networking stencils with Cisco equipment and standard networking symbols
Component Diagrams
For architectural and component diagrams, I've developed specific techniques using free tools. Creating dynamic MCP component diagrams requires attention to detail, but is entirely possible with free software.
Basic Component Diagram Example
A simplified component diagram showing system architecture:
flowchart LR
    subgraph Frontend
    A[User Interface] --- B[UI Controller]
    end
    subgraph Backend
    C[API Gateway] --- D[Business Logic]
    D --- E[Data Access Layer]
    end
    subgraph Database
    F[Primary DB]
    G[Cache]
    end
    B --> C
    E --> F
    D --> G
UML Diagrams
For UML diagrams, which are essential in software development, I recommend:
- UMLet: Lightweight, free tool focused exclusively on UML diagrams
- Diagrams.net: Offers comprehensive UML shape libraries for all diagram types
- Violet UML Editor: Simple, focused UML tool with a clean interface
Entity-Relationship Diagrams
For database modeling and ERD creation, I've found these free solutions particularly effective:
- dbdiagram.io: Text-based ERD creation with automatic layout
- ERDPlus: Free online tool specifically for database modeling
- Diagrams.net: Includes entity-relationship shape libraries and connectors
Designing Business Visuals with Zero-Cost Tools
Business visuals require a different approach than technical diagrams. I've developed strategies for creating professional business graphics without spending a dime.
Organizational Charts
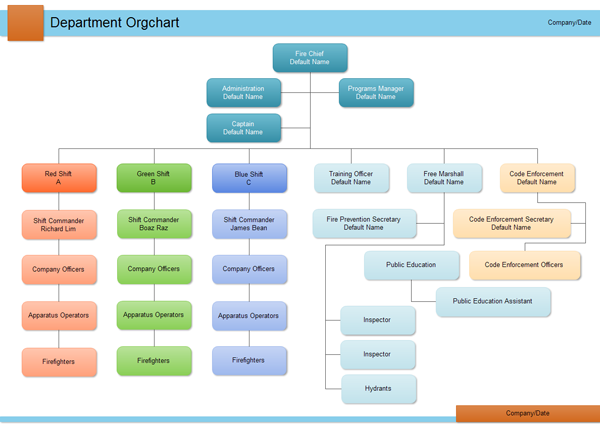
Creating clear hierarchy visualizations is essential for organizational understanding. I recommend:
- Diagrams.net: Offers specialized org chart templates with automatic layout options
- Canva: Provides visually appealing org chart templates that can be customized
- LibreOffice Draw: Includes organization chart tools with flexible styling options
Simple Organizational Chart Example
A basic organizational hierarchy that can be created with free tools:
flowchart TD
    CEO[CEO] --> COO[Chief Operations Officer]
    CEO --> CTO[Chief Technology Officer]
    CEO --> CMO[Chief Marketing Officer]
    COO --> PM1[Project Manager 1]
    COO --> PM2[Project Manager 2]
    CTO --> DEV1[Development Team]
    CTO --> DEV2[QA Team]
    CMO --> MKT1[Digital Marketing]
    CMO --> MKT2[Brand Management]
Mind Maps and Concept Diagrams
For strategic planning and concept visualization, I've had success with these free mind mapping tools:
- Freemind: Open-source mind mapping software with extensive features
- MindMup: Free online mind mapping with Google Drive integration
- Coggle: Intuitive, collaborative mind mapping with a generous free tier
Creating engaging visual process guides helps transform complex workflows into understandable sequences. I've found that even free tools can produce professional results when used effectively.
SWOT Analysis and Business Frameworks
Business frameworks like SWOT, Porter's Five Forces, or BCG matrices can be created effectively using:
- Canva: Offers templates specifically for business frameworks with modern styling
- Diagrams.net: Provides flexible grid layouts perfect for quadrant-based frameworks
- Google Slides: Simple but effective for creating basic business framework diagrams
SWOT Analysis Template
A visual representation of the SWOT framework:
Project Timelines and Roadmaps
Visualizing project timelines without premium software is possible with these approaches:
- Google Sheets: Can be used to create Gantt charts with conditional formatting
- ProjectLibre: Open-source project management software with Gantt chart capabilities
- GanttProject: Free, dedicated Gantt chart software for project planning
- Canva: Offers timeline templates that can be customized for project roadmaps
Accessibility Features in Free Diagramming Solutions
Creating inclusive diagrams is not just good practice—it ensures your visuals can be understood by everyone. I've researched how free tools address accessibility needs.

Screen Reader Compatibility
For users with visual impairments, screen reader compatibility is essential. I've evaluated free tools based on their support for assistive technologies:
Diagrams.net
Offers good screen reader support with proper element labeling and alt text for shapes. Export to accessible formats like SVG with ARIA attributes.
Canva
Improving accessibility with alt text support for elements and keyboard navigation, though some complex features remain challenging for screen readers.
LibreOffice Draw
Benefits from the LibreOffice suite's accessibility features, including good keyboard navigation and screen reader support.
Keyboard Navigation
For users with mobility limitations, keyboard navigation is crucial. My analysis of keyboard accessibility in free diagramming tools:
Keyboard Accessibility Comparison
How top free tools compare in keyboard navigation capabilities:
Color Customization for Inclusivity
Creating color-blind friendly diagrams requires careful consideration of color choices. I recommend these approaches in free tools:
- High contrast color schemes: Use tools that allow custom color palettes to ensure sufficient contrast
- Pattern differentiation: Use patterns in addition to colors to distinguish elements
- Color blindness simulators: Some free tools like Diagrams.net can integrate with browser extensions that simulate different types of color blindness
- Text labels: Supplement color coding with clear text labels to ensure information is not conveyed by color alone
Text Scaling and Readability
Ensuring text is readable for all users is critical for accessible diagrams:
- Font size control: Look for tools that allow sufficient minimum font sizes
- Scalable exports: SVG format ensures text remains readable when zoomed
- Font selection: Choose sans-serif fonts for better readability at small sizes
- Text contrast: Maintain a minimum 4.5:1 contrast ratio for text against backgrounds
Following visual communication best practices is essential for creating diagrams that are not only aesthetically pleasing but also accessible to all users. These principles ensure your diagrams effectively communicate to the widest possible audience.
Overcoming Limitations of Free Diagramming Tools
Free tools inevitably come with limitations, but I've developed effective workarounds to overcome these constraints without upgrading to paid versions.
Common Limitations and Solutions
| Limitation | Creative Workaround |
|---|---|
| Limited shape libraries |
|
| Export restrictions |
|
| File size/complexity limits |
|
| Limited collaboration |
|
| Storage constraints |
|
Combining Multiple Free Tools
I've found that using multiple free tools in combination can create a powerful diagramming ecosystem that rivals premium solutions:
Multi-Tool Workflow Example
A process for combining different free tools to create comprehensive diagrams:
flowchart LR
    A[Initial Concept] --> B[Diagrams.net]
    B --> C{Diagram Type?}
    C -->|Technical| D[yEd for Layout]
    C -->|Visual| E[Canva for Styling]
    C -->|Data-driven| F[Google Sheets]
    D --> G[Export as SVG]
    E --> G
    F --> G
    G --> H[Final Assembly]
    H --> I[PDF Export]
Complementary Free Resources
I leverage these additional free resources to enhance my diagramming capabilities:
- Icon libraries: Flaticon, Material Icons, and Font Awesome offer free icons to enhance diagrams
- Color palette generators: Coolors and Adobe Color provide harmonious color schemes
- Font repositories: Google Fonts and Font Squirrel offer free, high-quality typography
- Image editors: GIMP and Photopea for editing diagram elements
Community Extensions and Plugins
Many free diagramming tools support community-created extensions that add functionality:
- Diagrams.net plugins: Add specialized shape libraries and export options
- Browser extensions: Enhance web-based tools with additional capabilities
- Script libraries: For tools that support scripting (like yEd), community scripts add automation
- Integration connectors: Connect your diagramming tools to other free services
Future of Accessible Diagramming: AI-Powered Solutions
The diagramming landscape is being transformed by AI technologies. I've been exploring how these innovations are making visual communication more accessible than ever.

Emerging AI Tools for Diagram Creation
I'm particularly excited about these AI-powered approaches that are revolutionizing how we create diagrams:
Text-to-Diagram Conversion
AI systems that can interpret natural language descriptions and generate corresponding diagrams automatically. These tools are particularly valuable for users who find traditional diagramming interfaces challenging.
Intelligent Layout Optimization
AI algorithms that can automatically arrange diagram elements for optimal clarity and aesthetic appeal, eliminating the need for manual adjustments.
Style Transfer and Enhancement
AI that can apply consistent styling to rough diagrams, transforming basic sketches into professional-quality visuals.
Conversational Interfaces
One of the most exciting developments I've seen is the rise of conversational interfaces for diagram creation:
- Voice-controlled diagramming: Creating and editing diagrams through spoken commands
- Chatbot assistants: Guiding users through the diagram creation process with natural language
- Query-based editing: Modifying diagrams by describing the desired changes in plain language
The ability to transform text into professional diagrams with AI technology is particularly revolutionary. These systems can interpret descriptions and generate sophisticated visualizations without requiring manual element placement or styling.
AI-Assisted Diagram Creation Process
How AI is transforming the traditional diagramming workflow:
flowchart TD
    A[User Input] -->|Natural Language| B[AI Processing]
    B -->|Understanding Intent| C[Diagram Type Selection]
    B -->|Entity Recognition| D[Element Identification]
    B -->|Relationship Analysis| E[Connection Mapping]
    C --> F[Initial Layout Generation]
    D --> F
    E --> F
    F --> G[Style Application]
    G --> H[User Review]
    H -->|Feedback| I[AI Refinement]
    I --> H
    H -->|Approval| J[Final Diagram]
Machine Learning for Democratized Design
I'm seeing how machine learning continues to lower the barriers to creating professional diagrams:
- Design pattern recognition: AI that learns from existing high-quality diagrams to suggest improvements
- Personalized templates: Systems that learn user preferences and create customized starting points
- Accessibility enhancements: ML algorithms that automatically optimize diagrams for various accessibility needs
- Content-aware generation: AI that can analyze documents and automatically create appropriate visualizations
Traditional vs. AI-Assisted Diagramming
Comparison: Traditional vs. AI-Assisted Approaches
How AI tools compare to traditional diagramming across key metrics:
While traditional tools offer greater customization control, I've found that AI-assisted diagramming excels in speed, accessibility, and lowering the learning curve—making visual communication available to a much wider audience regardless of design expertise.
Case Studies: Successful Projects Using Free Diagramming Tools
Throughout my career, I've collected inspiring examples of how free diagramming tools have been used to create professional-quality visuals in various contexts.

Professional Diagrams Created with Free Software
Case Study 1: Tech Startup System Architecture
Challenge: A bootstrapped tech startup needed to document their complex microservice architecture for both technical and non-technical stakeholders without budget for expensive diagramming tools.
Solution: Using Diagrams.net with custom SVG icons, they created a comprehensive system architecture diagram with interactive elements that could be shared via web links.
Outcome: The diagrams became central to their technical documentation, onboarding processes, and investor presentations, helping secure their Series A funding.
Case Study 2: Educational Institution Curriculum Mapping
Challenge: A community college needed to visualize the relationships between courses, prerequisites, and learning outcomes across multiple departments with no budget for specialized tools.
Solution: Using yEd Graph Editor's automatic layout algorithms, they created a comprehensive curriculum map that clearly showed pathways through various programs.
Outcome: The visual curriculum maps improved student advising, increased completion rates, and simplified the accreditation review process.
Before-and-After Transformations
Information Complexity Reduction
How effective visualizations reduce perceived complexity:
Educational Institutions Leveraging Free Tools
I've observed numerous educational institutions successfully using free diagramming tools to enhance learning:
- Computer Science departments: Teaching system design with Diagrams.net
- Business schools: Using Canva for business model canvas creation
- Engineering programs: Implementing yEd for circuit and system diagrams
- K-12 education: Introducing mind mapping with SimpleMind to develop critical thinking
Startups Using Accessible Design Solutions
Startups with limited budgets are particularly adept at leveraging free diagramming tools:
"Our entire pitch deck was created using free diagramming tools. The investors couldn't believe we hadn't hired a professional designer. The quality of free tools today is remarkable."
— Founder, AI Analytics Startup
"We documented our entire product architecture using only free diagramming software. These visuals were instrumental during our technical due diligence process for acquisition."
— CTO, FinTech Startup
Freelancers Creating Client Deliverables
Independent professionals have shared how they create client-ready visuals without expensive software:
- UX consultants: Creating user flow diagrams and wireframes with Pencil Project
- Business analysts: Developing process maps and organizational charts with Diagrams.net
- Technical writers: Illustrating complex concepts with LibreOffice Draw
- Project managers: Building Gantt charts and roadmaps with ProjectLibre
Getting Started: Your Action Plan for Mastering Free Diagramming Tools
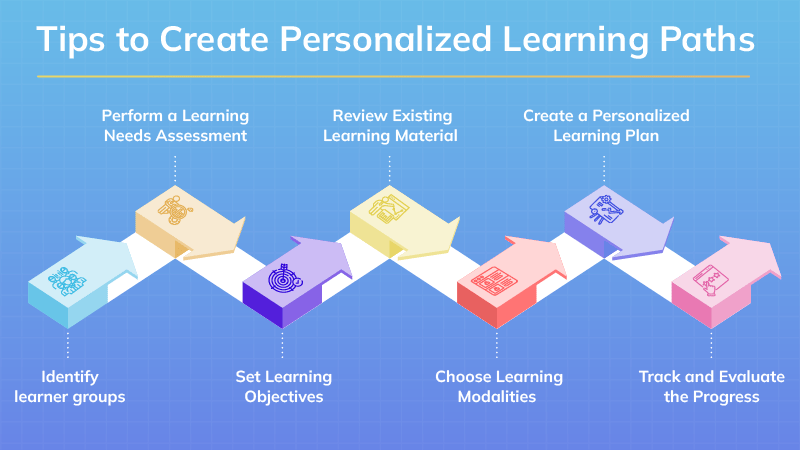
Based on my experience helping teams adopt free diagramming solutions, I've developed a structured approach to mastering these tools efficiently.
Systematic Learning Approach
Learning Path for Mastering Free Diagramming Tools
A structured approach to developing your diagramming skills:
flowchart TD
    A[Start Here] --> B[Select Primary Tool]
    B --> C[Complete Basic Tutorial]
    C --> D[Create Simple Diagram]
    D --> E[Learn Keyboard Shortcuts]
    E --> F[Practice Standard Diagrams]
    F --> G[Explore Advanced Features]
    G --> H[Develop Personal Templates]
    H --> I[Join Community Forums]
    I --> J[Study Expert Examples]
    J --> K[Create Complex Project]
    K --> L[Teach Others]
I recommend starting with one primary tool that best matches your most common diagram needs. Invest time in learning this tool thoroughly before expanding to others.
Creating a Personal Template Library
One of the most effective strategies I've implemented is building a personal template library:
- Identify your most frequently created diagram types
- Create base templates with your preferred settings (colors, fonts, connector styles)
- Include commonly used elements in each template
- Organize templates by purpose (technical, business, planning)
- Document any special techniques used in each template
Efficient Workflow Development
To maximize productivity with free tools, I've refined this workflow process:
1. Planning Phase
Sketch concepts on paper before opening any software. Identify the core message and essential elements.
2. Structure Phase
Create the basic structure using your chosen tool's quickest methods. Focus on layout and relationships, not aesthetics.
3. Content Phase
Add all textual content and ensure information accuracy before moving to styling.
4. Styling Phase
Apply consistent colors, fonts, and visual elements according to your template or style guide.
5. Review Phase
Critically assess the diagram for clarity, accuracy, and visual appeal. Get feedback if possible.
6. Export Phase
Create appropriate file formats for different uses (presentation, documentation, web).
File Organization Best Practices
Managing your diagram files effectively is crucial when using free tools with potential storage limitations:
- Consistent naming convention: Include date, version, and purpose in filenames
- Local backups: Don't rely solely on cloud storage in free tools
- Version control: Implement a simple versioning system for important diagrams
- Archive completed projects: Move finished work to compressed archives to save space
- Cross-reference documentation: Maintain a simple spreadsheet linking diagrams to their projects
Setting Realistic Improvement Goals
I encourage a structured approach to developing your visual communication skills:
Skill Development Timeline
A realistic progression of diagramming skills over time:
Set specific, achievable goals for each stage of your learning journey:
- Week 1: Complete basic tutorials and create your first simple diagram
- Month 1: Master one diagram type relevant to your work (flowchart, org chart, etc.)
- Month 3: Develop a personal template library and efficient workflow
- Month 6: Confidently create complex diagrams for professional use
Transform Your Visual Expressions with PageOn.ai
Ready to take your diagramming to the next level? PageOn.ai combines the accessibility of free tools with the power of AI to help you create stunning visualizations in minutes, not hours.
Start Creating with PageOn.ai TodayFinal Thoughts
Throughout my journey exploring free diagramming tools, I've discovered that budget constraints don't have to limit your ability to create professional, impactful visuals. The landscape of accessible design solutions continues to evolve, with AI-powered tools like PageOn.ai pushing the boundaries of what's possible without premium software.
I encourage you to experiment with the tools and techniques shared in this guide. Start with simple diagrams, gradually build your skills, and don't be afraid to combine multiple free resources to achieve your visualization goals.
Remember that effective visual communication isn't about having the most expensive tools—it's about clarity, purpose, and understanding your audience. With the free resources available today, anyone can become proficient at transforming complex information into compelling visual stories.
You Might Also Like
Mastering Content Rewriting: How Gemini's Smart Editing Transforms Your Workflow
Discover how to streamline content rewriting with Gemini's smart editing capabilities. Learn effective prompts, advanced techniques, and workflow optimization for maximum impact.
Transforming Presentations: Strategic Use of Color and Imagery for Maximum Visual Impact
Discover how to leverage colors and images in your slides to create visually stunning presentations that engage audiences and enhance information retention.
Enhancing Audience Experience with Strategic Audio Integration | Create Immersive Brand Connections
Discover how strategic audio integration creates immersive brand connections across podcasts, streaming platforms, and smart speakers. Learn frameworks and techniques to transform your marketing.
Revolutionizing Slides: The Power of AI Presentation Tools | PageOn.ai
Discover how AI presentation tools are transforming slide creation, saving hours of work while enhancing design quality. Learn how PageOn.ai can help visualize your ideas instantly.
