Understanding AI Diagrams: Visual Tools for Complex Intelligence Systems
Bridging Technical Complexity with Visual Clarity
I've found that AI diagrams serve as crucial bridges between abstract technical concepts and human understanding. In this guide, I'll walk you through what these powerful visual tools are, how they're created, and the many ways they're transforming how we develop, understand, and communicate about artificial intelligence.
The Fundamentals of AI Diagrams
When I first encountered complex AI systems, I quickly realized the power of visualization. AI diagrams are more than simple illustrations—they're sophisticated visual representations that translate abstract AI concepts into understandable graphics. In my experience, they function as essential bridges between highly technical concepts and human comprehension.
These visual tools combine elements from multiple disciplines:
- Data visualization techniques that make patterns visible
- Process mapping methodologies that illustrate workflows
- System architecture principles that show relationships between components
- Information design approaches that prioritize clarity and understanding
What separates AI diagrams from traditional diagrams is their ability to represent dynamic learning processes and complex decision-making pathways. While a standard flowchart might show a fixed sequence, an AI diagram often needs to illustrate adaptability, feedback loops, and probabilistic outcomes.

I've found that AI diagrams serve dual purposes in the field: they're educational tools that help newcomers understand AI concepts, and they're practical tools that assist developers in building and optimizing AI systems. This versatility makes them invaluable across the entire AI ecosystem.
Key Insight
The most effective AI diagrams strike a careful balance between technical accuracy and visual simplicity—providing enough detail to be useful without overwhelming the viewer with unnecessary complexity.
Core Types of AI Diagrams
In my work with AI systems, I've encountered several distinct categories of diagrams, each serving different purposes and audiences. Understanding these types of diagrams is essential for choosing the right visual approach for your specific needs.
Neural Network Architectures
Neural network diagrams visualize the structure of artificial neural networks—the computational systems inspired by the human brain that power many modern AI applications.
These diagrams typically show:
- Input, hidden, and output layers
- Connections (weights) between nodes
- Activation functions that transform data
- Data flow directions through the network
I find that well-designed neural network diagrams help demystify how these systems transform input data into meaningful outputs through layers of mathematical operations.
graph LR
    subgraph "Input Layer"
        I1((I1))
        I2((I2))
        I3((I3))
    end
    subgraph "Hidden Layer"
        H1((H1))
        H2((H2))
        H3((H3))
        H4((H4))
    end
    subgraph "Output Layer"
        O1((O1))
        O2((O2))
    end
    I1 --> H1
    I1 --> H2
    I1 --> H3
    I1 --> H4
    I2 --> H1
    I2 --> H2
    I2 --> H3
    I2 --> H4
    I3 --> H1
    I3 --> H2
    I3 --> H3
    I3 --> H4
    H1 --> O1
    H1 --> O2
    H2 --> O1
    H2 --> O2
    H3 --> O1
    H3 --> O2
    H4 --> O1
    H4 --> O2
A simple neural network with input, hidden, and output layers
AI System Flowcharts
AI system flowcharts map the logical sequence of operations in an AI application, showing how data and decisions flow through the system. I've used these extensively when planning new AI implementations.
flowchart TD
    A[Data Input] --> B{Data Quality Check}
    B -->|Good Quality| C[Preprocessing]
    B -->|Poor Quality| D[Data Cleaning]
    D --> C
    C --> E[Feature Extraction]
    E --> F[Model Selection]
    F --> G{Training or Inference?}
    G -->|Training| H[Train Model]
    G -->|Inference| I[Load Trained Model]
    H --> J[Evaluate Performance]
    J -->|Satisfactory| K[Save Model]
    J -->|Unsatisfactory| L[Tune Parameters]
    L --> H
    I --> M[Generate Predictions]
    K --> N[Deploy Model]
    M --> O[Post-process Results]
    O --> P[Output]
AI system flowchart showing the complete process from data input to output
These flowcharts are particularly valuable for identifying bottlenecks, optimization opportunities, and potential failure points in an AI system. They help me communicate the overall process to both technical and non-technical stakeholders.
Data Processing Pipelines
Data processing pipeline diagrams focus on how raw data transforms into insights through AI processing. These visualizations are crucial for data engineering teams and help ensure that data quality is maintained throughout the AI system.
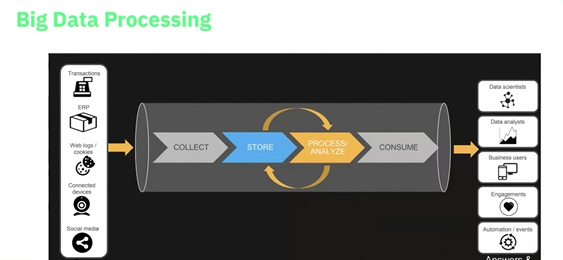
A well-designed data pipeline diagram illustrates:
- Data sources and collection methods
- Preprocessing and cleaning steps
- Feature extraction and selection processes
- Data storage and retrieval mechanisms
- Model training and validation workflows
Conceptual AI Frameworks
Conceptual framework diagrams provide high-level representations of AI system components and their relationships. I find these particularly useful for initial project planning and stakeholder communication.
flowchart LR
    subgraph "Data Management"
        A[Data Collection]
        B[Data Storage]
        C[Data Processing]
    end
    subgraph "AI Core"
        D[Model Development]
        E[Training System]
        F[Inference Engine]
    end
    subgraph "User Interface"
        G[API Layer]
        H[User Dashboard]
        I[Reporting Tools]
    end
    A --> B
    B --> C
    C --> D
    D --> E
    E --> F
    F --> G
    G --> H
    G --> I
Conceptual framework showing major components of an AI system
These diagrams abstract away technical details to focus on the big picture, making them ideal for communicating with business stakeholders, project managers, and cross-functional teams.
Comparing AI Diagram Types
| Diagram Type | Primary Purpose | Typical Audience | Level of Detail |
|---|---|---|---|
| Neural Network Architecture | Visualize model structure | Data scientists, ML engineers | High |
| AI System Flowchart | Show process logic | Developers, system architects | Medium to High |
| Data Processing Pipeline | Illustrate data transformation | Data engineers, analysts | Medium |
| Conceptual Framework | Communicate high-level structure | Stakeholders, project managers | Low |
Creating Effective AI Diagrams
Through my experience designing AI systems, I've learned that creating effective AI diagrams requires balancing technical accuracy with visual clarity. Let's explore the key elements that make AI diagrams truly effective.
Key Elements of Clarity
When I create AI diagrams, I focus on these essential elements:
- Consistent visual language: Using the same symbols, colors, and shapes for similar components throughout the diagram
- Appropriate level of detail: Including enough information to be useful without overwhelming the viewer
- Clear labeling: Adding concise, descriptive labels to all components and processes
- Strategic color use: Employing color to highlight important elements and create visual hierarchy
- Logical flow: Arranging elements to show clear relationships and sequences

Tools and Technologies
The right tools can make a significant difference in creating effective AI diagrams. I've explored various options, from traditional diagramming software to specialized AI visualization tools.
In my experience, AI block diagram whiteboards offer a powerful way to assemble complex system representations. PageOn.ai's AI Blocks feature has been particularly useful for quickly creating professional diagrams that accurately represent AI systems.
AI Diagramming Tools Comparison
Another powerful approach I've discovered is using PageOn.ai's Deep Search to integrate relevant technical elements and examples into diagrams. This feature helps ensure that diagrams are not only visually appealing but also technically accurate and up-to-date with the latest AI concepts.
PageOn.ai's Vibe Creation has also transformed how I work with AI diagrams by allowing me to convert verbal descriptions into structured visual diagrams. This is particularly valuable when:
- Quickly prototyping new diagram concepts
- Translating team discussions into visual representations
- Creating diagrams from research papers or technical documentation
Pro Tip
When creating AI diagrams, I start with a clear purpose statement that defines what the diagram should communicate and to whom. This helps me make better decisions about level of detail, terminology, and visual approach throughout the creation process.
Practical Applications of AI Diagrams
In my work across various industries, I've seen AI diagrams deliver tremendous value in multiple contexts. Let's explore how these visual tools are applied in real-world scenarios.
In Development and Engineering
For development teams, AI diagrams serve as essential documentation and planning tools. I've used them extensively for:
- System architecture documentation: Creating clear references for how components interact
- Identifying inefficiencies: Visualizing bottlenecks and optimization opportunities
- Standardizing AI models: Ensuring consistent development practices across teams
- Facilitating collaboration: Providing a common visual language for technical discussions
I've found that teams with well-documented AI diagrams typically experience fewer misunderstandings and develop more cohesive systems. The diagrams serve as a single source of truth that all team members can reference.

When implementing AI implementation strategies, these visual tools help bridge the gap between theoretical possibilities and practical applications.
In Education and Training
AI diagrams play a crucial role in education, making complex concepts accessible to students and professionals alike. I've seen these visual tools transform learning experiences by:
Breaking Down Complexity
Visualizing abstract AI concepts in ways that make them more concrete and understandable for learners at all levels
Tailoring to Expertise Levels
Creating different versions of diagrams with varying levels of detail to support learners from beginners to experts
Supporting Conceptual Understanding
Providing visual frameworks that help learners organize and connect AI concepts in meaningful ways
Enhancing Retention
Leveraging visual memory to improve long-term recall of complex AI principles and processes
I've found that AI diagrams are particularly valuable for AI homework assistance, helping students visualize concepts they're learning about in their coursework.
In Healthcare and Specialized Fields
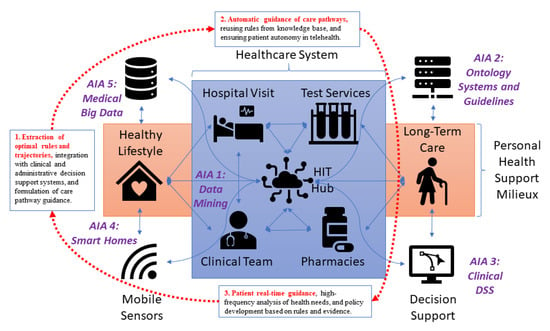
In specialized fields like healthcare, AI diagrams serve unique and critical purposes. I've worked with medical teams using diagrams to:
- Visualize AI diagnostic systems: Showing how patient data flows through analysis pipelines
- Represent patient data flows: Illustrating how privacy is maintained throughout AI processing
- Illustrate clinical decision support: Demonstrating how AI augments (not replaces) medical expertise
- Train medical professionals: Helping doctors and nurses understand AI tools in their workflow
These specialized diagrams require careful attention to domain-specific terminology and workflows, often blending AI concepts with field-specific processes.
Case Example: AI in Radiology
I recently worked with a radiology department implementing an AI-assisted diagnosis system. We created a comprehensive diagram showing:
flowchart LR
    A[Image Acquisition] --> B[Image Preprocessing]
    B --> C[AI Analysis]
    C --> D{Anomaly Detected?}
    D -->|Yes| E[Flag for Radiologist Review]
    D -->|No| F[Standard Report]
    E --> G[Radiologist Verification]
    G -->|Confirmed| H[Final Diagnosis]
    G -->|Rejected| I[AI Model Feedback]
    F --> H
    I --> J[Model Retraining]
AI-assisted radiology diagnosis workflow
This diagram helped radiologists understand where AI fit into their workflow, reduced anxiety about automation, and clarified the human-in-the-loop verification process. It became a reference point during training and implementation.
Case Studies: AI Diagrams in Action
Throughout my career, I've collected numerous examples of how well-crafted AI diagrams have made a tangible difference in real-world scenarios. Let me share some of these stories to illustrate their practical impact.
Technical Implementation Examples
Case Study: Financial Fraud Detection System
A fintech company I consulted with was struggling with a complex fraud detection system that had become difficult to maintain. The team had expanded rapidly, and knowledge of the system architecture was siloed among a few senior engineers.
We created a comprehensive set of AI diagrams documenting:
- Data flow from transaction sources to analysis engines
- Machine learning model pipeline and feature extraction
- Decision threshold logic and alert generation
- Feedback loops for continuous model improvement
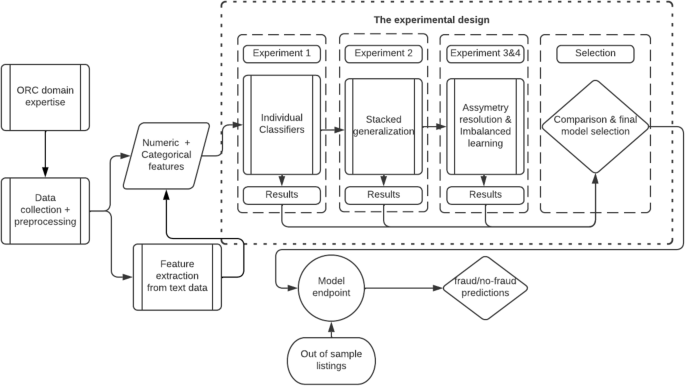
Results: The diagrams revealed several redundant processes and data duplications. After refactoring based on these insights, the system's processing time decreased by 37%, and the onboarding time for new engineers dropped from weeks to days. The diagrams became living documents that evolved with the system.
Educational Success Stories
Case Study: Graduate AI Program
I worked with a university computer science department that was revamping its graduate AI curriculum. Students were struggling with the conceptual leap from traditional programming to AI systems thinking.
We developed a series of progressive AI diagrams that:
- Started with high-level conceptual frameworks
- Gradually introduced technical components
- Used consistent visual language across all materials
- Included interactive elements that revealed additional detail on demand
- Connected theoretical concepts to practical applications
Results: Student comprehension scores increased by 28% compared to previous cohorts. Project quality improved significantly, with students demonstrating a more holistic understanding of AI systems. The visual approach was particularly beneficial for students from non-computer science backgrounds.
Business Communication Wins
Case Study: Healthcare AI Investment
A healthcare startup was seeking funding for an innovative AI diagnostic tool. Despite having groundbreaking technology, they struggled to communicate its value and function to potential investors who lacked technical backgrounds.
We developed a series of investor-focused AI diagrams that:
- Simplified complex technical concepts without sacrificing accuracy
- Highlighted the unique value proposition visually
- Showed clear differentiation from competitors
- Illustrated the patient and provider benefits
- Demonstrated the data security and privacy measures
Results: The startup secured $4.2 million in funding, with investors specifically citing the clarity of the technical approach as a key factor in their decision. The diagrams became central to their pitch deck and marketing materials.
Future Trends in AI Diagramming
As I look to the horizon of AI visualization, several exciting trends are emerging that will transform how we create and interact with AI diagrams. These developments promise to make diagrams more dynamic, accessible, and powerful as communication tools.
Interactive and Dynamic Representations
The future of AI diagrams is moving decidedly away from static images toward interactive, dynamic representations that respond to user input and real-time data. I'm particularly excited about:
- Explorable explanations: Diagrams that allow users to manipulate parameters and see how AI systems respond
- Real-time visualization: Diagrams connected to live systems that update as data flows and decisions are made
- Progressive disclosure: Interactive elements that reveal additional detail as users explore specific components
- Animated processes: Dynamic illustrations of how data transforms through AI pipelines
These interactive diagrams will be particularly valuable for understanding complex, non-linear processes like reinforcement learning and generative AI systems.

AI-Generated Diagrams
In an interesting meta-development, AI systems are increasingly being used to generate and optimize their own visual representations. This trend is accelerating with several key developments:
Automatic Architecture Visualization
AI systems that can analyze their own structure and generate accurate visual representations, adapting the level of detail to the intended audience
Natural Language to Diagram Conversion
Systems that can transform verbal or written descriptions of AI processes into professionally styled diagrams with minimal human intervention
Diagram Optimization
AI tools that analyze existing diagrams and suggest improvements for clarity, completeness, and visual appeal based on best practices and user engagement data
Code-to-Diagram Generation
Systems that automatically create visual representations from AI code repositories, helping developers understand complex codebases more quickly
PageOn.ai is at the forefront of this trend, offering powerful tools for automating complex diagram creation while maintaining human oversight of the final result. The AI compute visual guide demonstrates how these tools can transform technical concepts into clear visual representations.
Integration with Extended Reality

Perhaps the most exciting frontier in AI diagramming is the integration with extended reality (XR) technologies. I'm seeing promising developments in:
- 3D AI system visualization: Immersive representations that allow users to "walk through" AI architectures
- Spatial computing applications: Using AR/VR to create collaborative spaces where teams can manipulate AI diagrams together
- Multi-sensory feedback: Adding sound, haptic feedback, and other sensory dimensions to enhance understanding
- Digital twins: Creating virtual representations of AI systems that mirror their real-world performance
These XR approaches are particularly promising for understanding highly dimensional data and complex network architectures that are difficult to represent in two dimensions.
Looking Forward
As these trends converge, we're moving toward a future where AI diagrams become increasingly dynamic, personalized, and immersive. The distinction between "diagram" and "interactive experience" will continue to blur, creating new opportunities for understanding and communicating about AI systems.
Getting Started with AI Diagrams
Whether you're a seasoned AI professional or just beginning to explore this field, creating effective AI diagrams is a valuable skill. Here's my step-by-step approach to getting started with AI diagramming.
Step-by-Step Approach
flowchart TD
    A[Define Purpose & Audience] --> B[Select Appropriate Diagram Type]
    B --> C[Create Conceptual Framework]
    C --> D[Add Technical Components]
    D --> E[Review for Clarity & Accuracy]
    E --> F{Clear to Audience?}
    F -->|Yes| G[Finalize & Share]
    F -->|No| H[Simplify or Add Context]
    H --> E
Step-by-step process for creating effective AI diagrams
1. Define Purpose and Audience
Before creating any diagram, I always ask myself:
- What specific information needs to be communicated?
- Who will be using this diagram?
- What is their level of technical expertise?
- What decisions or actions should this diagram inform?
The answers to these questions guide all subsequent decisions about the diagram's content and style.
2. Select Appropriate Diagram Type
Based on your purpose and audience, choose the most appropriate diagram type:
- Neural network architecture for detailed model structure
- System flowchart for process logic and decision points
- Data pipeline for data transformation processes
- Conceptual framework for high-level system overview
3. Create Conceptual Framework
Start with a high-level outline of the major components and their relationships. This serves as the skeleton for your diagram and helps ensure that you've included all necessary elements before adding detail.
4. Add Technical Components
Once the framework is established, add technical details appropriate for your audience. Remember that different versions might be needed for different stakeholders—technical teams will need more detail than executive leadership.
5. Review for Clarity and Accuracy
Test your diagram with representatives from your target audience. Ask them to explain what they understand from the diagram and identify any points of confusion. Revise accordingly.
Common Pitfalls to Avoid
Overcomplicated Visuals
Trying to show everything at once can create diagrams that overwhelm rather than clarify. Break complex systems into multiple, focused diagrams when necessary.
Inconsistent Visual Language
Using different symbols or colors for the same component across your diagram creates confusion. Establish and maintain a consistent visual vocabulary.
Insufficient Context
Technical components without proper explanation or context can be meaningless to many viewers. Always provide enough surrounding information.
Ignoring Feedback
The ultimate test of a diagram is whether it successfully communicates to its intended audience. Be willing to revise based on user feedback.
Resources and Learning Materials
To continue developing your AI diagramming skills, I recommend these resources:
Recommended Tools
- PageOn.ai: Offers AI-powered diagramming with specialized templates for AI system visualization
- Mermaid.js: For creating programmatic diagrams that can be version-controlled alongside code
- Draw.io: A versatile diagramming tool with extensive shape libraries
- Figma: Great for collaborative design of more polished, presentation-ready diagrams
Learning Communities
- AI Visualization forums on Reddit and Stack Exchange
- LinkedIn groups focused on AI education and communication
- Academic visualization conferences and workshops
- Open-source AI project documentation teams
Transform Your AI Visualization with PageOn.ai
Ready to create professional AI diagrams that clearly communicate complex concepts? PageOn.ai's intuitive tools make it easy to design, share, and collaborate on visual representations of AI systems—no design experience required.
Start Creating with PageOn.ai TodayFinal Thoughts
As we've explored throughout this guide, AI diagrams are powerful tools for bridging the gap between complex technical concepts and human understanding. Whether you're developing AI systems, teaching AI concepts, or communicating with stakeholders, effective visualization is key to success.
I've found that the best AI diagrams balance technical accuracy with visual clarity, adapting to the needs of their specific audience while maintaining consistency in visual language. As AI systems continue to grow in complexity and importance, the ability to create clear, compelling visual representations will only become more valuable.
The future of AI diagramming is bright, with interactive, AI-generated, and immersive visualizations on the horizon. By mastering the fundamentals of AI diagramming today, you'll be well-positioned to leverage these exciting developments as they emerge.
I encourage you to start creating your own AI diagrams, using the principles and techniques we've discussed. With practice and feedback, you'll develop this essential skill that bridges the worlds of technical complexity and human understanding.
You Might Also Like
Transforming Industries with Language Models: From Summarization to Question Answering
Explore practical applications of language models from text summarization to question answering systems. Learn how LLMs are transforming healthcare, finance, e-commerce and more with PageOn.ai.
Streamlined Visual Creation: The Essential Minimalist Creator's Toolkit That Actually Works
Discover how to build a truly minimalist creator's toolkit that delivers results. Learn to overcome creative bottlenecks and build sustainable workflows that boost productivity without sacrificing quality.
Visualizing the CIA Triad: A Modern Framework for Cybersecurity Success
Discover how the CIA triad (Confidentiality, Integrity, Availability) forms the foundation of modern cybersecurity. Learn implementation strategies and visualization techniques for security success.
Mastering Investor Communication: Angel to Series C Fundraising Visuals
Learn how to adapt your fundraising visual strategy from Angel to Series C. Discover stage-specific investor communication techniques and create compelling fundraising materials.