Visualizing the Domino Effect: How Rising Interest Rates Transform Financial Markets
The Mechanics of Interest Rate Changes: Beyond the Numbers
When central banks adjust interest rates, they set in motion a complex chain reaction that ripples through every corner of the financial ecosystem. I've spent years analyzing these patterns, and in this guide, I'll walk you through how these seemingly simple numeric changes transform into market-wide shifts that affect everything from your mortgage to global currency values.
The Mechanics of Interest Rate Changes
Interest rates are the primary tool central banks use to manage economic conditions. When I analyze how these changes propagate through markets, I find it helpful to visualize the complete pathway from policy decision to market impact.
                    flowchart TD
                        A[Central Bank Decision] -->|Rate Increase| B[Money Supply]
                        A -->|Forward Guidance| M[Market Expectations]
                        B -->|Reduced Liquidity| C[Borrowing Costs]
                        C -->|Higher Expense| D[Corporate Profits]
                        C -->|Reduced Affordability| E[Consumer Spending]
                        C -->|Increased Payments| F[Mortgage Markets]
                        D -->|Lower Valuations| G[Stock Markets]
                        E -->|Decreased Demand| H[Retail Sector]
                        F -->|Reduced Activity| I[Real Estate Markets]
                        G & H & I -->|Combined Effect| J[Economic Growth]
                        J -->|Feedback Loop| A
                        M -->|Anticipatory Trading| G
                        classDef policy fill:#FF8000,stroke:#333,stroke-width:1px,color:white;
                        classDef impact fill:#42A5F5,stroke:#333,stroke-width:1px;
                        classDef outcome fill:#66BB6A,stroke:#333,stroke-width:1px;
                        class A policy;
                        class B,C,M impact;
                        class D,E,F,G,H,I,J outcome;
The propagation path of interest rate decisions through the financial system
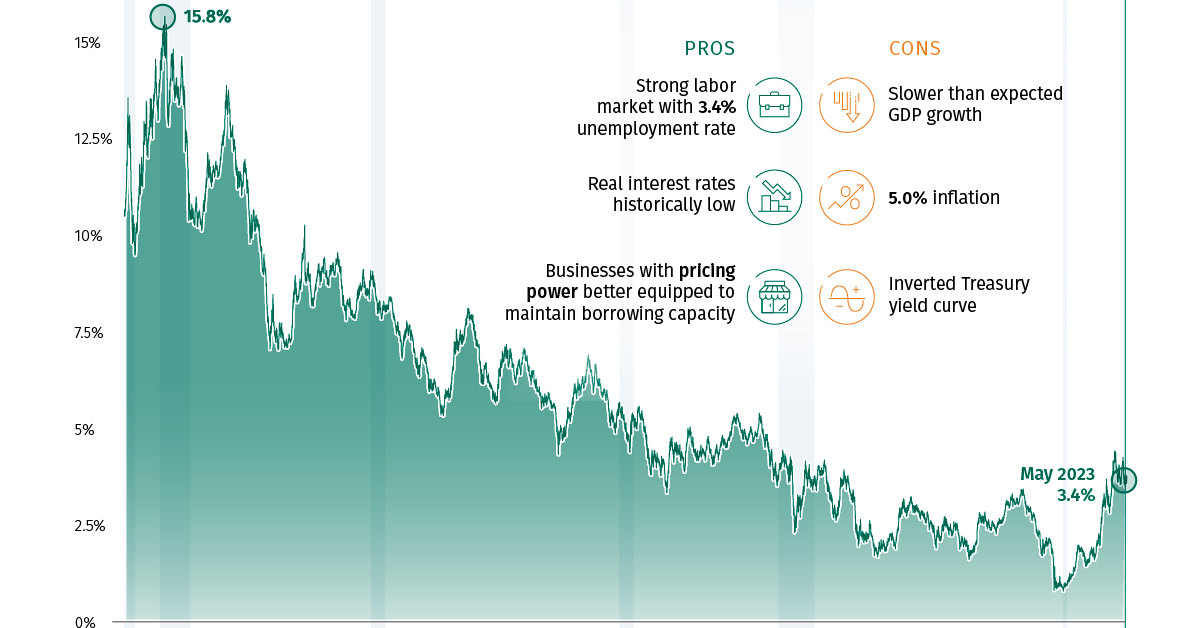
When examining historical patterns, we can see clear relationships between Federal Reserve rate decisions and subsequent market reactions. These patterns help us anticipate potential impacts of current policy shifts.
Understanding the difference between nominal rates (the stated percentage) and real rates (adjusted for inflation) is crucial for interpreting market reactions. When real rates turn negative, as we've seen during recent inflationary periods, the market impact can be counterintuitive.
Key Insight:
Markets often react more strongly to unexpected rate changes than to the absolute level of rates. Using PageOn.ai's AI Blocks, I've found that visualizing both the rate level and the surprise factor provides a more accurate prediction of market movements.
The Interconnected Web: Primary Market Impacts
Stock Markets
Rising interest rates affect different market sectors with varying intensity. Growth-oriented companies, particularly in technology, often face stronger headwinds as their future cash flows are discounted more heavily. In contrast, financial sector companies may benefit from wider lending margins.
One of the most visible impacts of rising rates is the compression of price-to-earnings (P/E) ratios. As wall street financial crises pattern recognition shows, this compression follows predictable patterns but varies significantly by sector.
Bond Markets
The bond market experiences some of the most direct and immediate impacts from interest rate changes. The inverse relationship between bond prices and yields creates significant challenges for fixed-income investors during rising rate environments.

3D visualization of yield curve transformations during rate hike cycles
Duration risk becomes particularly important during rate hike cycles. Longer-duration bonds face steeper price declines when rates rise, creating a challenging environment for traditional fixed income portfolios.
Real Estate
Few markets feel the impact of rising rates more directly than real estate. Mortgage rates typically climb in tandem with central bank rates, though not always in perfect correlation.

Housing affordability impact map by region (30-year mortgage rate at 7%)
Commercial real estate faces additional challenges as cap rates adjust to the new interest rate environment. This adjustment process can create significant valuation changes, particularly for properties with upcoming refinancing needs.
| Property Type | Low Rate Environment Cap Rate | High Rate Environment Cap Rate | Valuation Impact |
|---|---|---|---|
| Class A Office | 4.5% | 6.0% | -25% |
| Multi-family Residential | 4.0% | 5.2% | -23% |
| Industrial/Warehouse | 5.0% | 6.0% | -17% |
| Retail (Shopping Centers) | 5.5% | 7.2% | -24% |
| Healthcare Facilities | 5.2% | 6.1% | -15% |
Key Insight:
Using PageOn.ai's visualization tools, I've found that creating interactive comparisons between REITs and direct property investments helps investors see how different real estate vehicles respond to rate changes. The liquidity premium becomes particularly visible during rate transition periods.
Secondary Ripple Effects: Beyond Traditional Assets
Banking and Financial Institutions
While rising rates can benefit banks through expanded net interest margins, they also introduce new risks. The balancing act between deposit costs and loan yields becomes increasingly complex as rates climb.
                    flowchart TD
                        A[Interest Rate Increase] -->|Immediate Effect| B[Higher Loan Rates]
                        A -->|Lagged Effect| C[Higher Deposit Rates]
                        B -->|Revenue Impact| D[Increased Interest Income]
                        C -->|Cost Impact| E[Increased Interest Expense]
                        D & E -->|Net Effect| F[Net Interest Margin]
                        F -->|Profit Impact| G[Bank Profitability]
                        A -->|Secondary Effect| H[Loan Demand Reduction]
                        H -->|Volume Impact| I[Reduced Loan Originations]
                        I -->|Revenue Impact| J[Lower Fee Income]
                        J & G -->|Combined Effect| K[Overall Bank Performance]
                        A -->|Risk Effect| L[Credit Quality Concerns]
                        L -->|Loss Provisions| M[Increased Loan Loss Reserves]
                        M -->|Profit Impact| G
                        classDef primary fill:#FF8000,stroke:#333,stroke-width:1px,color:white;
                        classDef positive fill:#66BB6A,stroke:#333,stroke-width:1px;
                        classDef negative fill:#EF5350,stroke:#333,stroke-width:1px;
                        classDef neutral fill:#42A5F5,stroke:#333,stroke-width:1px;
                        class A primary;
                        class D,F,G positive;
                        class E,H,I,J,L,M negative;
                        class B,C,K neutral;
Bank performance dynamics during rising rate environments
As federal reserve system policies tighten, banking stress points can emerge, particularly for institutions with mismatched asset-liability durations. The 2023 regional banking challenges illustrated this vulnerability.
Currency Markets and Global Capital Flows
Interest rate differentials between countries drive significant currency movements and international capital flows. When a major central bank like the Federal Reserve raises rates ahead of other countries, it often strengthens that currency while potentially destabilizing emerging markets.
Global investors often chase yield across borders, creating significant capital movements that can both stabilize and destabilize recipient economies. These flows can be visualized as a dynamic network of interconnected markets.
Consumer Behavior Shifts
Rising interest rates directly impact consumer psychology and spending patterns. Major purchases that typically require financing—like homes, vehicles, and appliances—often see the most immediate demand changes.
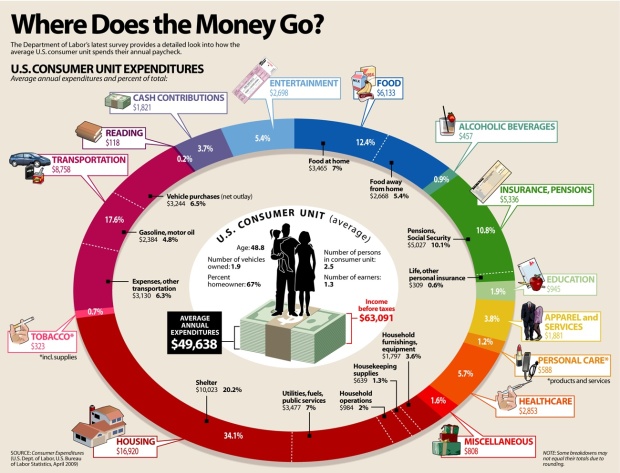
Consumer spending allocation shifts during rate increase cycles
The psychological impact of higher rates extends beyond simple affordability calculations. Consumer confidence and spending intent often decline even among households not directly affected by higher borrowing costs, creating broader economic ripples.
Key Insight:
Using PageOn.ai's interactive visualization tools, I've been able to map how consumer spending patterns shift across different demographic groups during rate hike cycles. This granular view reveals opportunities for businesses to adjust their product mix and marketing approach to align with changing consumer priorities.
Feedback Loops and Systemic Considerations
Economic Growth Cycles
Interest rate changes don't operate in isolation—they create feedback loops that affect the broader economy. Higher rates typically slow business investment, which can reduce hiring and eventually dampen consumer spending, creating a self-reinforcing cycle.
                    flowchart TD
                        A[Interest Rate Increases] -->|Cooling Effect| B[Business Investment]
                        B -->|Reduced Expansion| C[Employment Growth]
                        C -->|Income Effect| D[Consumer Spending]
                        D -->|Demand Effect| E[Corporate Revenue]
                        E -->|Profit Impact| F[Business Investment]
                        F --> C
                        A -->|Direct Effect| G[Consumer Borrowing]
                        G -->|Financing Cost| D
                        A -->|Asset Price Effect| H[Wealth Effect]
                        H -->|Financial Security| D
                        E -->|Tax Revenue| I[Government Spending]
                        I -->|Fiscal Stimulus| D
                        A -->|Debt Service| J[Government Interest Expense]
                        J -->|Budget Constraints| I
                        classDef monetary fill:#FF8000,stroke:#333,stroke-width:1px,color:white;
                        classDef business fill:#42A5F5,stroke:#333,stroke-width:1px;
                        classDef consumer fill:#66BB6A,stroke:#333,stroke-width:1px;
                        classDef government fill:#AB47BC,stroke:#333,stroke-width:1px;
                        class A,G,H monetary;
                        class B,E,F business;
                        class C,D consumer;
                        class I,J government;
Economic feedback loops created by interest rate policy changes
An important but often overlooked aspect of rising rates is the time lag between policy implementation and observable economic impacts. This delay creates challenges for policymakers and investors alike.
Market Psychology and Sentiment Analysis
Market participants often react to anticipated rate changes well before they actually occur. This forward-looking behavior creates distinct market phases around central bank announcements.
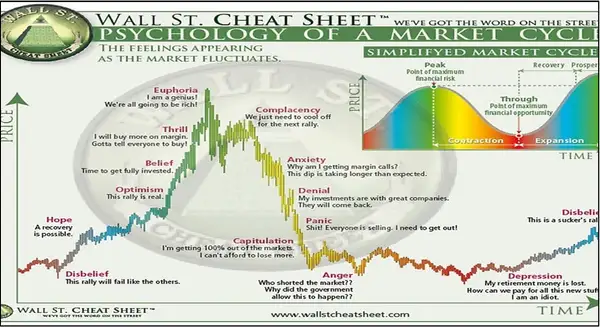
Market sentiment cycle during interest rate policy shifts
The concept of "priced in" expectations is crucial for understanding market movements around rate decisions. Markets often show their strongest reactions when actual policy changes deviate from widely expected outcomes.
Potential System Stressors
Rising interest rates can expose hidden vulnerabilities in the financial system, particularly for entities with high leverage or mismatched funding structures. Creating investment banking pitch decks that highlight these risks requires clear visualization of complex financial relationships.
                    flowchart TD
                        A[Rising Interest Rates] -->|Stress Factor| B[Debt Service Coverage]
                        A -->|Stress Factor| C[Asset-Liability Duration Mismatch]
                        A -->|Stress Factor| D[Liquidity Constraints]
                        A -->|Stress Factor| E[Collateral Value Decline]
                        B & C & D & E -->|Combined Effect| F[Systemic Stress]
                        F -->|Potential Outcome| G[Market Volatility]
                        F -->|Potential Outcome| H[Credit Contraction]
                        F -->|Potential Outcome| I[Forced Asset Sales]
                        F -->|Potential Outcome| J[Institutional Failures]
                        G & H & I & J -->|Policy Response| K[Central Bank Intervention]
                        K -->|Feedback Loop| A
                        classDef trigger fill:#FF8000,stroke:#333,stroke-width:1px,color:white;
                        classDef stress fill:#EF5350,stroke:#333,stroke-width:1px;
                        classDef outcome fill:#AB47BC,stroke:#333,stroke-width:1px;
                        classDef response fill:#66BB6A,stroke:#333,stroke-width:1px;
                        class A trigger;
                        class B,C,D,E,F stress;
                        class G,H,I,J outcome;
                        class K response;
Financial system stress points during rising rate environments
Early warning indicators can help identify potential financial stability concerns before they become systemic. Monitoring these signals across multiple markets provides a more comprehensive view of emerging risks.
Key Insight:
Using PageOn.ai's data visualization capabilities, I've created interconnected dashboards that track early warning indicators across multiple markets simultaneously. This approach helps identify potential stress points that might be missed when examining markets in isolation.
Strategic Adaptation: Investment Approaches in Rising Rate Environments
Asset Allocation Strategies
Adapting investment portfolios for rising rate environments requires thoughtful reallocation across asset classes. Historical performance patterns provide valuable guidance, though each rate cycle has unique characteristics.
Portfolio optimization during rising rate periods often involves increasing allocations to shorter-duration fixed income, value stocks, and inflation-sensitive assets like commodities and infrastructure.
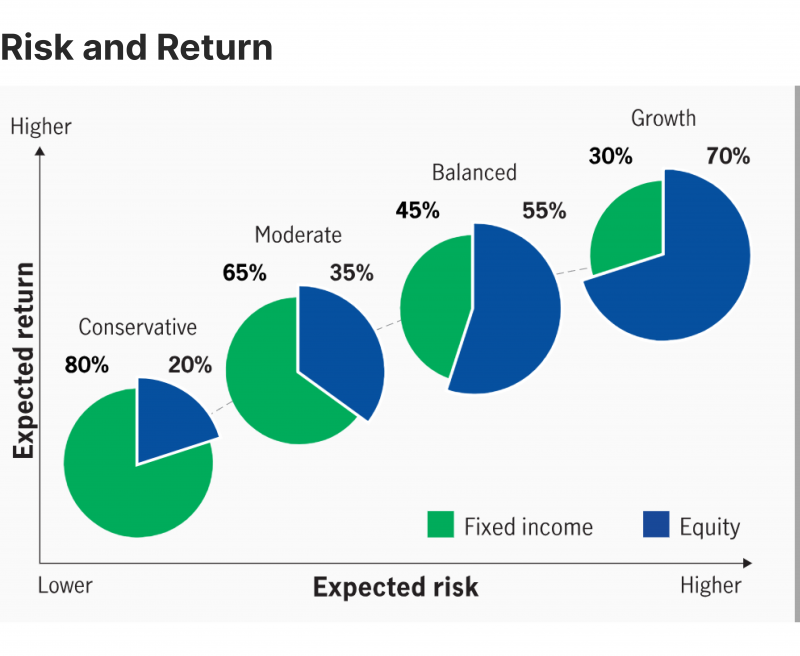
Optimal portfolio allocation shifts for rising rate environments
Sector Rotation Opportunities
Different economic sectors exhibit varying sensitivities to interest rate changes. Understanding these relationships can help identify potential outperformers during rising rate periods.
The relationship between interest rate sensitivity and sector performance isn't static—it evolves based on starting valuations, economic conditions, and the pace of rate changes. Creating adaptive sector rotation strategies requires monitoring these dynamic relationships.
Risk Management Techniques
Effective risk management during rising rate environments involves both defensive positioning and strategic hedging. Duration management becomes particularly important for fixed-income portfolios.
                    flowchart TD
                        A[Rising Rate Risk Management] -->|Fixed Income Strategy| B[Duration Management]
                        A -->|Equity Strategy| C[Sector Rotation]
                        A -->|Alternative Strategy| D[Real Assets]
                        A -->|Derivatives Strategy| E[Hedging Techniques]
                        B -->|Tactical Approach| F[Short Duration]
                        B -->|Tactical Approach| G[Floating Rate]
                        B -->|Tactical Approach| H[Laddered Maturities]
                        C -->|Overweight| I[Rate-Beneficiary Sectors]
                        C -->|Underweight| J[Rate-Sensitive Sectors]
                        D -->|Inflation Protection| K[Commodities]
                        D -->|Inflation Protection| L[Infrastructure]
                        E -->|Hedging Tool| M[Interest Rate Futures]
                        E -->|Hedging Tool| N[Options Strategies]
                        classDef strategy fill:#FF8000,stroke:#333,stroke-width:1px,color:white;
                        classDef approach fill:#42A5F5,stroke:#333,stroke-width:1px;
                        classDef tactical fill:#66BB6A,stroke:#333,stroke-width:1px;
                        class A strategy;
                        class B,C,D,E approach;
                        class F,G,H,I,J,K,L,M,N tactical;
Risk management framework for rising interest rate environments
Stress testing portfolios against various rate increase scenarios helps identify potential vulnerabilities before they materialize. These tests should examine both direct interest rate sensitivity and secondary effects like credit spread widening.
Key Insight:
Using PageOn.ai's scenario modeling tools, I've found that visualizing multiple potential rate paths and their portfolio impacts helps investors better understand their risk exposure. This approach transforms abstract risk concepts into tangible visual scenarios that facilitate more informed decision-making.
Future Outlook: Visualizing Potential Scenarios
Scenario Mapping
Anticipating future interest rate paths requires considering multiple scenarios based on economic data, inflation trends, and central bank communications. Decision trees help visualize these potential paths and their market implications.
                    flowchart TD
                        A[Current Rate Environment] -->|Persistent Inflation| B[Continued Rate Hikes]
                        A -->|Moderating Inflation| C[Rate Plateau]
                        A -->|Economic Weakness| D[Rate Cuts]
                        B -->|Market Impact| E[Extended Bear Market]
                        B -->|Market Impact| F[Yield Curve Inversion]
                        B -->|Economic Impact| G[Recession Risk]
                        C -->|Market Impact| H[Range-Bound Markets]
                        C -->|Market Impact| I[Sector Rotation]
                        C -->|Economic Impact| J[Slow Growth]
                        D -->|Market Impact| K[Market Rally]
                        D -->|Market Impact| L[Bond Recovery]
                        D -->|Economic Impact| M[Stimulus Effect]
                        classDef current fill:#FF8000,stroke:#333,stroke-width:1px,color:white;
                        classDef scenario fill:#42A5F5,stroke:#333,stroke-width:1px;
                        classDef market fill:#EF5350,stroke:#333,stroke-width:1px;
                        classDef economic fill:#66BB6A,stroke:#333,stroke-width:1px;
                        class A current;
                        class B,C,D scenario;
                        class E,F,H,I,K,L market;
                        class G,J,M economic;
Interest rate scenario decision tree with market implications
Monitoring early indicators helps identify which scenario is becoming most likely. These indicators include inflation data, labor market metrics, manufacturing surveys, and central bank communication tone.
Long-term Structural Considerations
Beyond cyclical rate movements, persistent higher rates could reshape economic structures and business models. Industries built on cheap financing may need to fundamentally rethink their approach.
Historical comparisons with previous high-rate environments provide valuable context, though today's highly financialized economy may respond differently than in past cycles. Understanding these structural shifts requires both historical perspective and forward-looking analysis.
Comparing economic structures during historical high-rate environments
The interaction between monetary policy, fiscal policy, and demographic trends will shape long-term interest rate trajectories. These complex relationships can be better understood through text diffusion models and other advanced visualization approaches.
Key Insight:
Using PageOn.ai's advanced visualization capabilities, I've found that creating interactive scenario comparisons helps investors prepare for multiple potential outcomes rather than betting on a single forecast. This approach encourages more robust, adaptable investment strategies that can perform reasonably well across various interest rate environments.
Transform Your Financial Insights with PageOn.ai
Turn complex market relationships into clear, compelling visualizations that help your clients understand the ripple effects of interest rate changes across their portfolios.
Start Creating with PageOn.ai TodayConclusion: Navigating the Ripple Effects
The ripple effects of rising interest rates extend far beyond simple numeric changes, transforming market dynamics, investment strategies, and economic structures. By visualizing these complex relationships, we can better understand potential impacts and adapt our approaches accordingly.
As we've seen, these effects aren't limited to traditional financial markets—they extend to consumer behavior, global capital flows, and long-term economic structures. Understanding these interconnections is essential for navigating rising rate environments successfully.
The most effective way to communicate these complex relationships is through clear, intuitive visualizations. Whether you're explaining market dynamics to clients, creating language diffusion models to predict market narratives, or developing investment strategies, visual expression transforms abstract concepts into actionable insights.
With tools like PageOn.ai, creating these powerful visualizations becomes accessible to everyone—from financial advisors to portfolio managers to economic researchers. By transforming complex financial relationships into clear visual stories, we can better prepare for whatever interest rate environment lies ahead.
You Might Also Like
Transform Your AI Results by Mastering the Art of Thinking in Prompts | Strategic AI Communication
Master the strategic mindset that transforms AI interactions from fuzzy requests to crystal-clear outputs. Learn professional prompt engineering techniques that save 20+ hours weekly.
The Science Behind Success: How AI-Powered Content Creation Delivers 25% Higher Success Rates
Discover why AI users report 25% higher content success rates. Learn proven strategies, productivity gains, and competitive advantages of AI-powered content creation.
How AI Amplifies Marketing Team Capabilities While Preserving Human Jobs | Strategic Marketing Enhancement
Discover how AI transforms marketing teams into powerhouses without reducing workforce size. Learn proven strategies for capability multiplication and strategic enhancement.
Creating Visual AI Ethics Frameworks: A Leadership Guide for Modern Business | PageOn.ai
Discover how to develop comprehensive visual AI ethics frameworks for your organization. This guide helps business leaders translate complex ethical principles into clear visual guidelines.