Creating Professional Diagrams with AI Tools
A Comprehensive Guide to Transforming Ideas into Visual Assets
In today's data-driven world, I've found that clear visual communication is essential for conveying complex ideas effectively. AI-powered diagram tools have revolutionized how we create visual representations, making the process more accessible and efficient than ever before. This guide will walk you through everything you need to know about leveraging AI to create professional diagrams that communicate your ideas with clarity and impact.
Understanding AI-Powered Diagram Creation
When I first started working with diagrams, I spent countless hours wrestling with complex design software. Today, AI has completely transformed this process. AI-powered diagram tools interpret natural language descriptions and automatically generate visual representations, making diagram creation accessible to everyone, regardless of technical expertise.

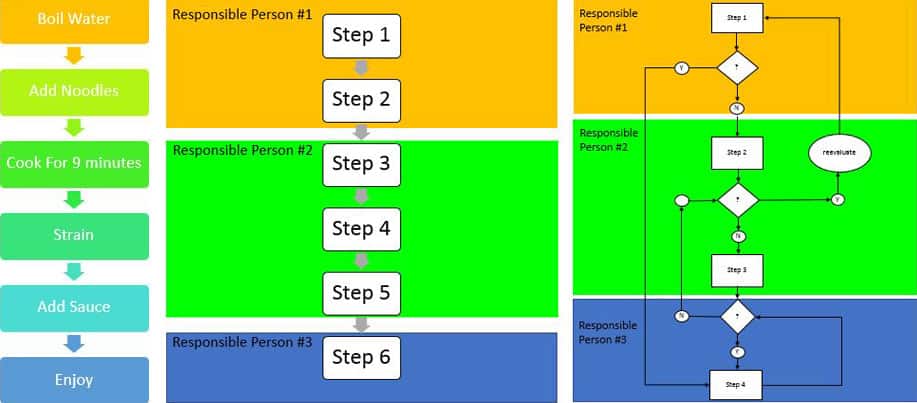
Traditional vs. AI-powered diagram creation workflows
Key Advantages of AI Diagram Tools
- Time Efficiency: What used to take hours now takes minutes. I can generate complex diagrams through simple text prompts, dramatically accelerating the visualization process.
- Reduced Learning Curve: No need to master complex software interfaces or diagram-specific syntax.
- Iterative Improvement: AI tools allow for conversational refinement, making it easy to adjust and improve diagrams through natural dialogue.
- Consistency: AI maintains visual consistency across multiple diagram types and projects.
Types of Diagrams AI Can Create
flowchart TD
    root[AI Diagram Types] --> flow[Flowcharts]
    root --> seq[Sequence Diagrams]
    root --> class[Class Diagrams]
    root --> state[State Diagrams]
    root --> org[Organizational Charts]
    root --> mind[Mind Maps]
    root --> process[Process Maps]
    root --> erd[Entity Relationship Diagrams]
    style root fill:#FF8000,color:#fff
    style flow fill:#f9f9f9,stroke:#FF8000
    style seq fill:#f9f9f9,stroke:#FF8000
    style class fill:#f9f9f9,stroke:#FF8000
    style state fill:#f9f9f9,stroke:#FF8000
    style org fill:#f9f9f9,stroke:#FF8000
    style mind fill:#f9f9f9,stroke:#FF8000
    style process fill:#f9f9f9,stroke:#FF8000
    style erd fill:#f9f9f9,stroke:#FF8000
Common diagram types that can be created using AI tools
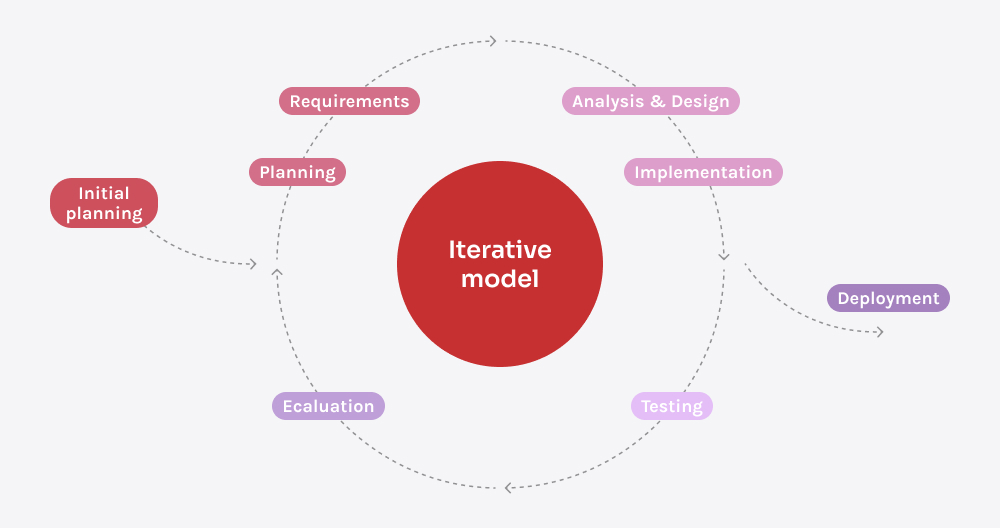
I've found that AI-powered flowchart tools are particularly effective for visualizing processes and workflows, while mind maps excel at organizing brainstorming sessions and planning projects. The versatility of AI diagram generators means you can create virtually any type of visual representation needed for your specific use case.
Selecting the Right AI Diagramming Tool
With numerous AI diagram tools available, choosing the right one for your specific needs can be overwhelming. I've experimented with many options and found that the best choice depends on your specific requirements, technical expertise, and integration needs.
Tool Comparison
| Tool Type | Strengths | Best For |
|---|---|---|
| Specialized AI Diagram Tools (e.g., Diagramming AI) |
|
Technical documentation, software architecture, complex systems |
| Integrated Visual Platforms (e.g., PageOn.ai) |
|
Business presentations, educational content, marketing materials |
| Free AI Diagram Generators |
|
Simple diagrams, personal projects, learning |
Essential Features to Consider
Feature comparison between specialized tools and integrated platforms like PageOn.ai
In my experience, the most important features to look for include:
- Natural Language Processing: How well does the tool understand your instructions and translate them into visual elements?
- Template Library: A robust selection of pre-designed templates can accelerate your workflow.
- Customization Options: The ability to refine and adjust generated diagrams to match your specific requirements.
- Integration Capabilities: How well does the tool work with your existing software ecosystem?
PageOn.ai's AI Blocks for Modular Diagram Construction

PageOn.ai's AI Blocks interface for modular diagram construction
One of the most innovative approaches I've encountered is AI block diagram whiteboards, which allow you to build complex visual structures without technical expertise. PageOn.ai's AI Blocks feature exemplifies this approach, enabling users to:
- Break down complex diagrams into modular components
- Combine different diagram elements with simple commands
- Maintain visual consistency across different diagram sections
- Iterate quickly through different visual approaches
When selecting a tool, I recommend starting with your specific use case and working backward to find the solution that best addresses your needs. For comprehensive visual communication that extends beyond diagrams, integrated platforms like PageOn.ai offer significant advantages through their contextual understanding and seamless integration with other visual elements.
Step-by-Step Diagram Creation Process
Creating effective diagrams with AI involves more than simply asking the AI to "make a diagram." Through trial and error, I've developed a systematic approach that consistently produces high-quality results.
Preparing Your Diagram Requirements
flowchart TD
    A[Define Purpose & Audience] -->|Informs| B[Gather Information]
    B -->|Shapes| C[Determine Diagram Type]
    C -->|Guides| D[Create Initial Prompt]
    D -->|Generates| E[Review AI Output]
    E -->|Requires| F{Satisfactory?}
    F -->|No| G[Refine Prompt]
    G -->|Leads to| D
    F -->|Yes| H[Finalize Diagram]
    style A fill:#FF8000,color:#fff
    style H fill:#FF8000,color:#fff
The AI diagram creation workflow process
Before engaging with an AI tool, I always clarify:
- Purpose: What specific problem is this diagram solving?
- Audience: Who will be viewing this diagram and what is their technical expertise?
- Information Requirements: What data points, relationships, or processes need to be represented?
Creating Your First AI-Generated Diagram
Effective Prompt Examples
❌ Ineffective Prompt:
"Make a diagram about customer onboarding."
✅ Effective Prompt:
"Create a flowchart showing the customer onboarding process for a SaaS product. Include 5 main stages: signup, verification, profile setup, product tour, and first task completion. Use orange for primary actions and blue for decision points. The audience is new team members with no prior knowledge of our process."
I've found that the most effective prompts include:
- Diagram Type: Explicitly state what kind of diagram you want (flowchart, sequence diagram, mind map, etc.)
- Content Elements: List the key components that should be included
- Relationship Instructions: Explain how different elements relate to each other
- Visual Preferences: Specify any color schemes, styles, or visual hierarchies you prefer
Refining the Output with AI Assistance
Iterative refinement process using AI feedback
The initial output rarely meets all requirements perfectly. This is where the iterative refinement process becomes valuable. With PageOn.ai's Vibe Creation feature, I can adjust the style and tone of my diagrams through natural language requests:
Refinement Prompt Examples
Style Adjustment:
"Make this diagram more minimalist with fewer colors and simplified shapes."
Content Refinement:
"Add a decision point after the 'Data Analysis' step that branches to either 'Report Generation' or 'Further Investigation' based on findings."
Audience Adaptation:
"Simplify the technical terminology in this diagram for a non-technical audience."
The ability to have a conversational interaction with the AI about your diagram is what truly sets modern tools apart from traditional diagramming software. Through this dialogue, you can progressively refine your visualization until it perfectly matches your vision.
For particularly complex diagrams, I recommend breaking the creation process into stages, first establishing the overall structure and then refining specific sections. This approach prevents the AI from becoming overwhelmed with too many requirements at once and typically results in more coherent visualizations.
Advanced Techniques for Complex Diagrams
Once you've mastered the basics, you can leverage AI for more sophisticated diagramming challenges. These advanced techniques have helped me tackle complex visualization projects that would be extremely time-consuming with traditional methods.
Generating Diagrams from Existing Content
sequenceDiagram
    participant User
    participant AI
    participant Code
    participant Diagram
    User->>AI: Upload code or document
    AI->>Code: Parse and analyze
    Code-->>AI: Structure and relationships
    AI->>Diagram: Generate visual representation
    Diagram-->>User: Present initial diagram
    User->>AI: Request refinements
    AI->>Diagram: Update visualization
    Diagram-->>User: Deliver final diagram
Process flow for generating diagrams from existing content
Modern AI chart generators can analyze existing content and automatically transform it into visual representations. Some of the most powerful applications include:
- Code to Flowchart Conversion: Visualizing program logic and execution paths from source code
- Document to Diagram Extraction: Identifying processes and relationships described in text documents
- Image Recognition for Diagram Recreation: Using PageOn.ai's Deep Search to extract diagram structures from images or whiteboard photos
This capability is particularly valuable when working with legacy systems or documentation that lacks visual aids. I've used it to quickly understand complex codebases and to transform text-heavy process documents into clear visual workflows.
Creating Interconnected Diagram Systems

Example of interconnected diagram system with hierarchical relationships
For complex systems, a single diagram is often insufficient. AI tools can help create interconnected diagram systems that represent different levels of abstraction or various aspects of a system. Key approaches include:
- Hierarchical Diagrams: Creating parent-child relationships between diagrams at different levels of detail
- Cross-Referenced Visualizations: Establishing connections between related diagrams that represent different views of the same system
- Consistent Visual Language: Maintaining uniform styling and notation across multiple diagrams
Incorporating Data Visualizations within Diagrams
Data visualization that can be incorporated into process diagrams
Some of the most compelling diagrams I've created combine structural visualization with data representation. PageOn.ai excels at this hybrid approach, allowing you to:
- Embed Charts Within Process Steps: Incorporating performance metrics at relevant points in a workflow diagram
- Create Data-Driven Diagrams: Adjusting the size or color of diagram elements based on quantitative values
- Automatically Source Relevant Data: Using PageOn.ai to find and integrate appropriate data visualizations that support your diagram's narrative
This integration of ai tools for excel charts and diagram creation is particularly valuable for business presentations and technical documentation, where the combination of process visualization and performance data can provide powerful insights.
Practical Applications Across Industries
AI-generated diagrams have transformed how I approach visualization challenges across various industries. The versatility of these tools makes them applicable to a wide range of use cases.
Business Process Optimization
Business process optimization diagram with bottleneck identification
In business settings, I've used AI-generated diagrams to:
- Map Complex Workflows: Visualizing end-to-end business processes to identify inefficiencies
- Identify Bottlenecks: Highlighting process constraints through visual analysis
- Develop Decision Trees: Creating structured frameworks for operational decisions
- Present Process Improvements: Comparing current and proposed workflows side by side
Technical Documentation and System Architecture
flowchart TD
    Client[Client Application] -->|HTTP Requests| API[API Gateway]
    API -->|Authentication| Auth[Auth Service]
    Auth -->|Token Validation| DB1[(User Database)]
    API -->|Product Queries| Products[Product Service]
    Products -->|Data Retrieval| DB2[(Product Database)]
    API -->|Order Processing| Orders[Order Service]
    Orders -->|Transaction Management| DB3[(Order Database)]
    Orders -->|Notifications| Queue[Message Queue]
    Queue --> Notifications[Notification Service]
    Notifications -->|Email| Email[Email Provider]
    Notifications -->|SMS| SMS[SMS Provider]
    style Client fill:#f9f9f9,stroke:#FF8000
    style API fill:#FF8000,color:#fff
    style Auth fill:#f9f9f9,stroke:#666
    style Products fill:#f9f9f9,stroke:#666
    style Orders fill:#f9f9f9,stroke:#666
    style Notifications fill:#f9f9f9,stroke:#666
System architecture diagram for an e-commerce application
For technical teams, AI-generated diagrams have proven invaluable for:
- API Flow Visualization: Documenting request/response patterns and data transformations
- System Architecture Documentation: Creating clear visual representations of complex technical systems
- Infrastructure Mapping: Visualizing network topologies and server configurations
- Database Schema Representation: Illustrating entity relationships and data structures
Educational and Training Materials
Learning pathway timeline for educational curriculum planning
In educational contexts, I've leveraged AI diagrams to create:
- Concept Maps: Visualizing relationships between complex ideas and theories
- Learning Pathways: Mapping curriculum progression and knowledge dependencies
- Process Explanations: Breaking down complex procedures into understandable visual steps
- Comparative Frameworks: Illustrating differences and similarities between related concepts
Across all these applications, I've found that ai compute visual guide resources help teams understand not just the diagrams themselves but also the computational resources required to generate them efficiently. This is particularly important when working with large-scale visualization projects that may require significant processing power.
Best Practices for Effective AI Diagram Creation
Through extensive experimentation and practical application, I've developed a set of best practices that consistently lead to more effective AI-generated diagrams.
Design Principles for Clear Visual Communication

Visual design principles applied to diagram creation
Even with AI assistance, understanding fundamental design principles remains crucial:
- Color Coding Strategies: Use color purposefully to group related elements or highlight important components. I typically limit my palette to 4-5 colors maximum.
- Visual Hierarchy: Guide the viewer's attention by using size, color, and positioning to indicate importance.
- Information Density: Balance completeness with clarity—sometimes creating multiple focused diagrams is better than one overwhelming visualization.
- Consistent Notation: Maintain consistent symbols, shapes, and labels throughout your diagrams.
Collaboration and Sharing Considerations
flowchart TD
    A[Create Initial Diagram] -->|Share| B[Team Review]
    B -->|Provide| C[Feedback Collection]
    C -->|Generate| D[Revision Prompts]
    D -->|Create| E[Updated Versions]
    E -->|Track| F[Version Control]
    F -->|Select| G[Final Export]
    G -->|Distribute| H[Multiple Formats]
    style A fill:#FF8000,color:#fff
    style H fill:#FF8000,color:#fff
Collaborative diagram development workflow
When working with teams, I've found these practices essential:
- Version Control: Maintain a clear history of diagram iterations, including the prompts that generated each version.
- Feedback Integration: Collect team input in a structured format that can be directly translated into AI refinement prompts.
- Export Flexibility: Ensure diagrams can be exported in formats compatible with your team's presentation and documentation tools.
- Accessibility Considerations: Design with accessibility in mind, including text alternatives and color choices that work for colorblind viewers.
Leveraging PageOn.ai's Agentic Capabilities
Comparison of agentic capabilities vs. traditional diagramming tools
PageOn.ai's agentic approach to diagram creation offers several unique advantages:
- Strategic Planning: The AI can help plan complex diagram projects, breaking them into manageable components.
- Reference Research: PageOn.ai can search for relevant examples and best practices to inform your diagram design.
- Feedback Implementation: The system can intelligently interpret and apply feedback, maintaining consistency across revisions.
- Cross-Format Consistency: Ensure visual consistency when creating multiple diagram types for the same project.
By combining these best practices with the power of AI, I've been able to create diagrams that not only look professional but also communicate complex ideas with remarkable clarity. The key is to view the AI as a collaborative partner in the creative process rather than a replacement for human judgment and expertise.
Future Trends in AI-Powered Diagramming
As someone deeply immersed in visual communication technologies, I'm excited about the emerging trends in AI-powered diagramming. The capabilities we see today are just the beginning of a profound transformation in how we create and interact with visual information.
Emerging Capabilities in Diagram Intelligence

Future interface concept for predictive diagramming with AI
In the near future, we can expect to see:
- Predictive Diagramming: AI systems that can extrapolate complete diagrams from partial information, similar to how code completion works in programming.
- Alternative Visualization Suggestions: Tools that automatically generate multiple visualization approaches for the same data, allowing users to select the most effective representation.
- Intelligent Diagram Evolution: Diagrams that automatically update as underlying systems or processes change, maintaining an accurate visual representation over time.
- Contextual Understanding: AI that can interpret the broader context of your project and suggest appropriate diagram types and structures without explicit instruction.
Integration with Broader AI Ecosystems
Current vs. projected future capabilities in AI diagramming ecosystems
The future of AI diagramming lies in deeper integration with broader AI ecosystems:
- Cross-Platform Visual Consistency: AI systems that maintain consistent visual language across documents, presentations, websites, and interactive applications.
- Multimodal Input Processing: Diagram creation from multiple input types—voice, text, sketches, gestures—simultaneously.
- Intelligent Visual Adaptation: Diagrams that automatically adapt to different display contexts, audiences, and purposes while maintaining their core information.
- Collaborative Intelligence: AI systems that can mediate and integrate input from multiple team members into cohesive visual representations.
The Role of PageOn.ai in Visual Communication's Future
Platforms like PageOn.ai are at the forefront of this visual communication revolution, working to transform how we express abstract concepts through clear visual assets. The integration of advanced AI capabilities with intuitive interfaces is making sophisticated visualization accessible to everyone, regardless of their technical or design background.
As these technologies continue to evolve, we can expect:
- Democratized Visual Communication: Professional-quality diagrams created by anyone with an idea to express
- Real-time Visual Collaboration: Multiple users co-creating and refining diagrams simultaneously with AI assistance
- Dynamic Visual Documentation: Living diagrams that evolve as projects develop and requirements change
- Cross-Cultural Visual Adaptation: Diagrams that can be automatically adapted for different cultural contexts and languages
The future of diagramming isn't just about better tools—it's about fundamentally changing how we communicate complex ideas. By removing technical barriers and amplifying human creativity, AI-powered diagram tools like PageOn.ai are enabling clearer, more effective visual communication across all domains of human knowledge and endeavor.
Transform Your Visual Expressions with PageOn.ai
Ready to revolutionize how you create diagrams? PageOn.ai combines powerful AI with intuitive design tools to help you transform complex ideas into crystal-clear visual assets—no technical expertise required.
Start Creating with PageOn.ai TodayConclusion
Throughout this guide, we've explored the transformative potential of AI-powered diagram creation tools. From understanding the fundamentals to mastering advanced techniques, I've shared my experience navigating this rapidly evolving landscape.
The ability to quickly transform complex ideas into clear visual representations is no longer limited to design professionals. With tools like PageOn.ai, anyone can create professional-quality diagrams that communicate effectively and engage audiences.
As you begin your journey with AI diagram creation, remember that the technology is meant to amplify your creativity and insight, not replace it. The most effective diagrams still begin with a clear understanding of what you want to communicate and to whom.
I encourage you to experiment with these tools, starting with simple diagrams and gradually exploring more complex visualizations. The investment in learning these capabilities will pay dividends across virtually every professional and educational context where clear communication is valued.
With platforms like PageOn.ai continuously evolving to offer more powerful and intuitive features, there's never been a better time to enhance your visual communication toolkit with AI-powered diagramming.
You Might Also Like
Strategic Icon Selection Guide: Achieving Visual Consistency in Design Systems
Learn how to create visual harmony through intentional icon systems. Our comprehensive guide covers selection criteria, styling guidelines, and implementation strategies for cohesive design.
Essential Elements Every Successful Startup Pitch Deck Must Include | PageOn.ai Guide
Discover the 9 essential elements every winning startup pitch deck needs, from compelling opening hooks to financial projections that captivate investors and secure funding.
PDR Security Framework: Visualizing Protection, Detection & Response Systems
Explore the PDR Security Framework with visual guides to Protection, Detection, and Response systems. Learn implementation strategies with interactive diagrams and actionable insights.
Beyond The Pitch: Visualizing Startup Traction Metrics That Win VC Funding
Discover the essential startup traction metrics that venture capitalists truly value. Learn how to visualize growth, efficiency, and revenue metrics to secure funding for your startup.