Creating Professional-Grade Diagrams Instantly with AI-Driven Text Commands
Transform complex ideas into stunning visuals with the power of AI and natural language
The Evolution of Diagram Creation
I've watched the transformation of diagram creation over the decades, from painstaking manual illustrations to today's sophisticated digital tools. When I first started creating business diagrams, it involved rulers, stencils, and hours of careful drawing. The shift to digital tools was revolutionary, but even then, the learning curve remained steep.
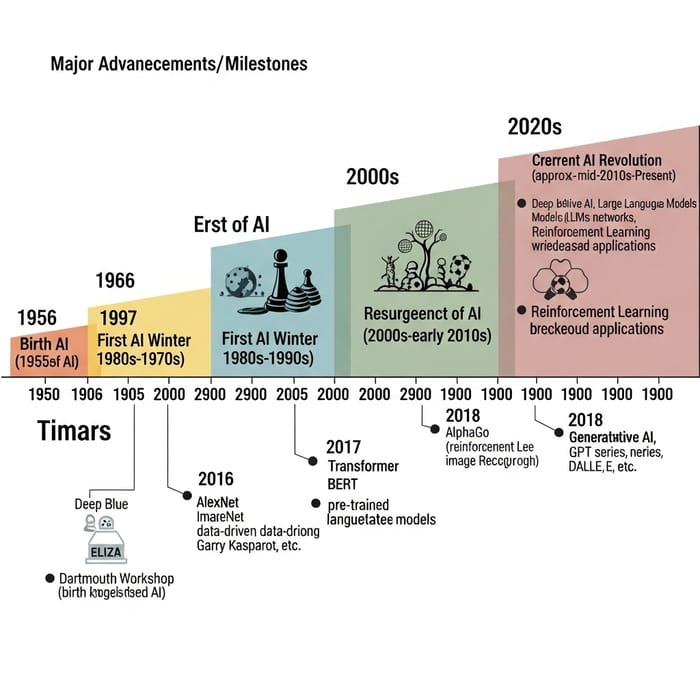
The evolution of diagram creation methods over time
In my consulting experience, visual communication has always been held to exceptionally high standards. Clients expect polished, professional diagrams that clearly articulate complex concepts at a glance. This expectation created significant barriers for many professionals:
- Mastering specialized diagramming software required substantial time investment
- Developing design skills needed for professional-looking outputs wasn't part of standard business training
- Creating high-quality diagrams often required multiple iterations and hours of work
- Maintaining consistency across large sets of diagrams was challenging and time-consuming
The emergence of text to graphic AI tools has completely revolutionized this landscape. I now find myself able to generate consulting-quality diagrams in seconds by simply describing what I want. This represents a fundamental shift in how we approach visual communication in professional settings.
flowchart LR
    A[Manual Era\n1950s-1980s] -->|Digitization| B[Software Era\n1980s-2010s]
    B -->|AI Integration| C[Text-to-Diagram Era\n2020s-Present]
    subgraph "Time Investment"
        A1[Days] --> B1[Hours] --> C1[Minutes]
    end
    subgraph "Skill Requirements"
        A2[Drawing Skills] --> B2[Software Proficiency] --> C2[Prompt Engineering]
    end
    style A fill:#FF8000,color:#fff
    style B fill:#FF8000,color:#fff
    style C fill:#FF8000,color:#fff,stroke-width:3px
The shifting paradigms in diagram creation methodology
I've found that this technological evolution hasn't just made diagram creation faster—it's democratized access to high-quality visual communication. Teams across organizations can now produce consistent, professional diagrams without specialized design resources.
Understanding AI-Powered Diagram Generation
The technology that enables me to convert natural language into structured visual elements is truly fascinating. At its core, AI-powered diagram generation relies on a sophisticated interplay between language understanding and visual composition principles.
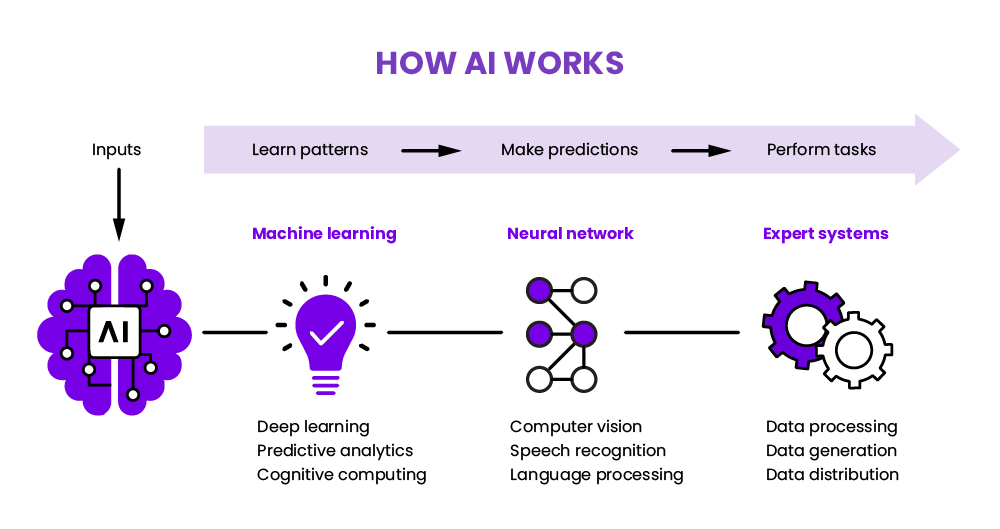
The AI processing pipeline for text-to-diagram conversion
When I enter a text prompt describing a diagram, here's what happens behind the scenes:
flowchart TD
    A[Text Input] --> B[Natural Language Processing]
    B --> C{Intent Classification}
    C -->|Diagram Structure| D[Layout Engine]
    C -->|Visual Elements| E[Component Generator]
    C -->|Relationships| F[Connection Mapper]
    D & E & F --> G[Visual Composition]
    G --> H[Rendered Diagram]
    style A fill:#FF8000,color:#fff
    style H fill:#FF8000,color:#fff
The processing flow of text-to-diagram AI systems
The key technologies that enable this transformation include:
Natural Language Processing
Interprets user intent, extracts entities, and understands relationships from descriptive text
Computer Vision Principles
Applies layout optimization algorithms to ensure visual balance, readability, and aesthetic appeal
Knowledge Graphs
Maintains logical relationships between entities and ensures conceptual accuracy in the visual representation
In my experience working with various AI-powered flowchart tools, I've found significant differences in their capabilities and specializations. Here's a comparison of how they perform across different use cases:
What I find most impressive is how these AI systems can maintain conceptual accuracy while creating visually appealing layouts. The technology continues to advance rapidly, with newer systems becoming increasingly adept at handling complex, multi-layered diagram requests with minimal guidance.
Types of Consulting Diagrams Achievable Through Text Input
In my consulting practice, I've successfully used AI-powered tools to generate a wide variety of professional diagrams. Here are the main categories I've found to be particularly effective when created through text input:
Strategic Frameworks and Business Models
I regularly use text commands to generate sophisticated strategic frameworks like Porter's Five Forces, SWOT analyses, and value chain visualizations. The AI accurately places components in the correct relationships while maintaining visual clarity.
For business model canvases, I've found that detailed text descriptions of each component allow the AI to create comprehensive visualizations that would have taken hours to design manually.

AI-generated business model canvas from text description
Process Flows and System Architectures
flowchart TD
    A[Customer Request] --> B{Validation}
    B -->|Valid| C[Process Payment]
    B -->|Invalid| D[Error Handling]
    C --> E[Inventory Check]
    E -->|In Stock| F[Fulfillment]
    E -->|Out of Stock| G[Backorder Process]
    F --> H[Shipping]
    G --> I[Vendor Order]
    I --> H
    H --> J[Delivery]
    D --> K[Customer Notification]
    K --> A
    style A fill:#FF8000,color:#fff
    style J fill:#FF8000,color:#fff
Order processing workflow generated from text description
For process flows, I've found that AI tools excel at translating my text descriptions into logically structured diagrams. By describing the sequence of steps, decision points, and parallel processes, I can generate detailed workflow diagrams in seconds.
System architecture diagrams require more specific terminology in the prompts, but when done correctly, the results are impressive. I can describe component relationships, data flows, and integration points to create comprehensive system maps.
Data Visualizations and Analytical Frameworks
Market share distribution chart generated from text description
I've successfully used AI chart generators to transform text descriptions into compelling data visualizations. By describing the data relationships and desired insights, I can quickly generate charts that highlight key findings.
For analytical frameworks like cause-and-effect diagrams (fishbone/Ishikawa), I provide a description of the problem and contributing factors, and the AI arranges them in the proper hierarchical structure.
Organizational Structures and Relationship Maps
One of my favorite applications is generating stakeholder maps from text descriptions. I can describe the various stakeholders, their influence levels, and relationships to create comprehensive visualizations that guide engagement strategies.
For organizational charts, I've found that describing reporting structures and team compositions allows AI to generate clean, hierarchical visualizations that can be easily refined.

Stakeholder influence map generated from text description
Crafting Effective Text Prompts for Diagram Generation
Through extensive experimentation, I've developed a framework for creating highly effective prompts that consistently produce quality diagrams. The difference between a mediocre and exceptional diagram often lies in how well the prompt is constructed.
The Anatomy of an Effective Diagram Prompt
Create a [DIAGRAM TYPE] showing [PRIMARY SUBJECT] with [NUMBER] [COMPONENTS]
connected by [RELATIONSHIP TYPE]. Use [COLOR SCHEME] with [SPECIFIC STYLE ELEMENTS].
Include [ADDITIONAL DETAILS] and organize in [LAYOUT PREFERENCE].
Essential Elements to Include
Diagram Type Specification
Be explicit about the diagram type you want (flowchart, mind map, org chart, etc.)
Entity Relationships
Clearly define how elements relate to each other
Visual Style Preferences
Specify design elements like shapes, line styles, and layout
Color Schemes
Define color preferences or branding requirements
Step-by-Step Prompt Engineering
flowchart LR
    A[Identify\nDiagram Purpose] --> B[Specify\nDiagram Type]
    B --> C[Define Core\nComponents]
    C --> D[Establish\nRelationships]
    D --> E[Add Visual\nPreferences]
    E --> F[Include\nRefinement Details]
    style A fill:#FF8000,color:#fff
    style B fill:#FF8000,color:#fff
    style C fill:#FF8000,color:#fff
    style D fill:#FF8000,color:#fff
    style E fill:#FF8000,color:#fff
    style F fill:#FF8000,color:#fff
The prompt engineering process for diagram generation
I've found that starting with a clear purpose and progressively adding detail leads to the best results. For example, when creating a customer journey map, I might use this progression:
Basic: "Create a customer journey map for an e-commerce website."
Better: "Create a horizontal customer journey map with 5 stages from discovery to post-purchase for an e-commerce website."
Best: "Create a horizontal customer journey map with 5 stages (Discovery, Consideration, Purchase, Delivery, Support) for a luxury e-commerce website. Include customer emotions as a line graph below each stage, touchpoints in rounded rectangles, and pain points in red diamonds. Use a color scheme transitioning from light blue to dark blue across the stages."
Common Pitfalls in Text Prompting
| Pitfall | Example | Better Approach |
|---|---|---|
| Vague terminology | "Make a nice diagram about marketing" | "Create a funnel diagram showing 4 stages of digital marketing conversion" |
| Conflicting instructions | "Create a simple diagram with 25 detailed components" | "Create a diagram with 5 main components, each with 4-5 sub-elements" |
| Omitting relationship details | "Show departments and teams" | "Show 4 departments with their respective teams as a hierarchical structure" |
| Ignoring visual hierarchy | "Show all 15 steps in our process" | "Show our 15-step process grouped into 3 phases with distinct colors" |
I've learned that iterative refinement is often the key to perfect diagrams. Starting with a basic prompt and then adding specificity based on the initial output has proven to be an efficient approach for complex visualizations.
Enhancing AI-Generated Diagrams for Consulting Standards
While AI-generated diagrams provide an excellent starting point, I've developed several techniques to elevate them to meet the exacting standards expected in consulting environments.
Refining Automatically Generated Diagrams
Once I have the initial AI output, I focus on several key refinement areas:
- Standardizing terminology for consistency across all client materials
- Adjusting visual hierarchy to emphasize key insights and findings
- Enhancing readability through spacing, grouping, and alignment
- Adding explanatory annotations where complex concepts need clarification
These refinements typically take minutes rather than the hours required to create diagrams from scratch.
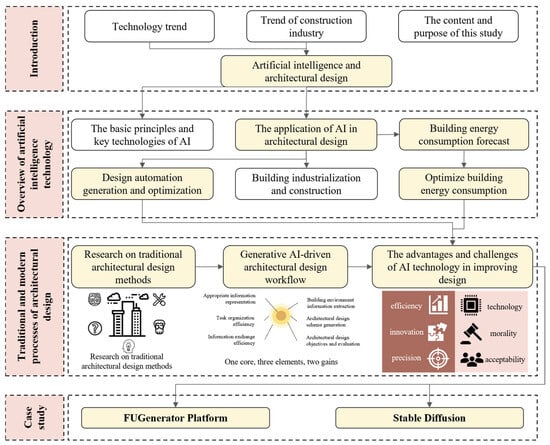
Before and after refinement of an AI-generated diagram
Incorporating Corporate Branding
For client-facing materials, I ensure all diagrams reflect the client's visual identity:
Color Palette
Primary and secondary brand colors
Logo Integration
Strategic placement of client logo
Typography
Corporate fonts and text styling
Shape Style
Consistent visual elements
I've found that strategic infographic planning principles can dramatically elevate simple diagrams. By applying these principles, even basic flowcharts can become compelling visual narratives that engage stakeholders.
Ensuring Consistency Across Diagram Sets
For comprehensive presentations with multiple diagrams, I maintain consistency by:
- Creating a diagram style guide that defines standards for all visual elements
- Using consistent terminology across all diagrams to prevent confusion
- Maintaining the same color coding scheme for similar concepts across different diagrams
- Ensuring consistent use of shapes and connector styles for similar relationship types
One of my favorite features when working with PageOn.ai is the AI Blocks functionality. It allows me to rapidly iterate on specific diagram components without starting over. For example, if a client wants to explore different approaches to visualizing a particular process, I can generate multiple variations of just that component and seamlessly integrate the preferred option into the master diagram.
Real-World Applications and Use Cases
I've successfully deployed AI-generated diagrams across various consulting scenarios. Here are some of the most impactful applications I've experienced:
Client Presentations and Pitch Decks
When preparing client presentations, I've found that AI-generated diagrams allow me to rapidly visualize complex value propositions. In one recent pitch, I needed to explain a multi-faceted digital transformation strategy. Using text prompts, I created a comprehensive ecosystem diagram in minutes that would have taken hours with traditional tools.
The ability to quickly iterate based on client feedback during meetings has been particularly valuable. When a client suggests a different approach, I can generate an alternative visualization on the spot, making presentations more dynamic and responsive.
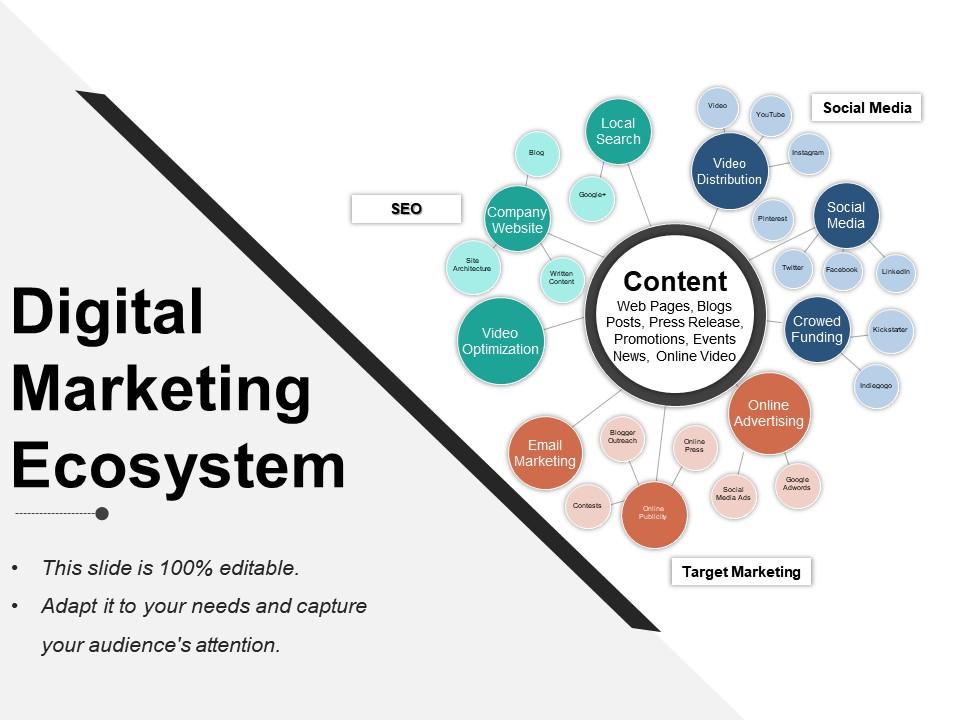
AI-generated ecosystem diagram for a client pitch deck
Strategic Planning Sessions
mindmap
    root((Strategic\nPriorities))
        Market Expansion
            Enter APAC region
                Identify local partners
                Regulatory compliance
            Enhance digital channels
                Mobile experience
                Social commerce
        Product Innovation
            AI-powered features
                Predictive analytics
                Personalization
            Sustainability initiative
                Eco-friendly packaging
                Carbon offset program
        Operational Excellence
            Supply chain optimization
                Vendor consolidation
                Inventory management
            Process automation
                Order processing
                Customer service
        Talent Development
            Leadership training
            Technical upskilling
Real-time mind map visualization from a strategic planning session
During strategic planning workshops, I now use AI diagram tools to visualize brainstorming outcomes in real time. As participants contribute ideas, I capture them as text and instantly generate visual representations that help structure the conversation.
This approach has significantly improved engagement and alignment during planning sessions. When participants see their ideas immediately visualized, they can more easily identify connections, gaps, and opportunities for refinement.
Implementation Roadmaps
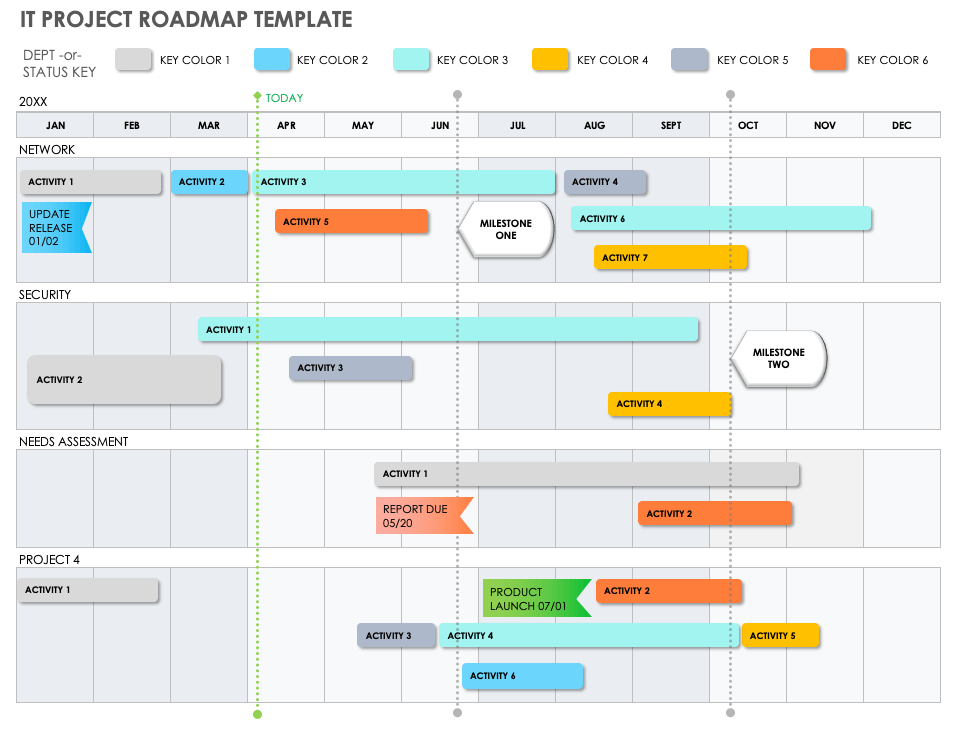
Multi-phase implementation roadmap created from text description
For complex implementation projects, I've leveraged text-to-diagram tools to create clear visual roadmaps. By describing project phases, dependencies, and milestones in text, I can generate comprehensive timeline visualizations that help stakeholders understand the implementation journey.
These visualizations have proven particularly valuable for multi-year transformation initiatives where maintaining a clear view of the big picture is essential for stakeholder alignment.
Training and Knowledge Transfer
When developing training materials for clients, I use AI-generated diagrams to create a consistent visual language that enhances learning. For example, when documenting complex processes for employee onboarding, I've created step-by-step visual guides that dramatically improve comprehension compared to text-only instructions.
The consistency and clarity of these diagrams help new team members grasp complex concepts more quickly and reduce the time required for knowledge transfer during transitions.
Comparison of information retention rates by documentation type
The Future of AI Document Creation for Consulting
As I look ahead, I see several exciting developments on the horizon for AI document creation in consulting contexts:
Dynamic Data Integration
Future AI diagram tools will connect directly to live data sources, automatically updating visualizations as underlying data changes. This will enable real-time dashboards and dynamic reports that maintain consulting-quality design standards.
Collaborative AI Diagramming
Multi-user collaborative environments where team members can simultaneously contribute to diagram creation through text inputs. AI will synthesize and harmonize these contributions into cohesive visualizations in real-time.
Cross-Format Integration
AI systems will seamlessly translate diagrams between formats—from slide decks to interactive web experiences to print documents—while maintaining visual consistency and quality across all mediums.
PageOn.ai's Deep Search capabilities represent a particularly exciting advancement in this space. This feature allows consultants to instantly find and integrate relevant visual assets from vast repositories of content, ensuring that diagrams leverage existing knowledge and maintain consistency with previous work.
flowchart TD
    A[Text Input] --> B[AI Processing]
    B --> C{Content Type}
    C -->|Diagrams| D[Visual Structure Generation]
    C -->|Data| E[Chart Generation]
    C -->|Process| F[Workflow Visualization]
    D & E & F --> G[Initial Visualization]
    G --> H{Enhancement Layer}
    H -->|Branding| I[Style Application]
    H -->|Data| J[Live Data Connection]
    H -->|Context| K[Deep Search Integration]
    I & J & K --> L[Final Output]
    L --> M[Interactive Web]
    L --> N[Presentation Slides]
    L --> O[Print Documents]
    L --> P[Collaboration Platform]
    style A fill:#FF8000,color:#fff
    style L fill:#FF8000,color:#fff
    style M fill:#66BB6A,color:#fff
    style N fill:#66BB6A,color:#fff
    style O fill:#66BB6A,color:#fff
    style P fill:#66BB6A,color:#fff
Future AI document creation workflow with multi-format output
As these technologies continue to evolve, I anticipate a fundamental shift in how consulting deliverables are created. Rather than spending hours on diagram creation, consultants will focus on strategic thinking and insight development, with AI handling the visualization process with increasing sophistication.
Getting Started: A Practical Implementation Guide
Based on my experience implementing AI diagram tools across consulting teams, here's a practical guide to getting started:
Selecting the Right AI Diagram Tool
| Tool Type | Best For | Considerations |
|---|---|---|
| Specialized Diagram AI | Teams focused on specific diagram types (e.g., process flows, org charts) | Deep capabilities in narrow use cases, may require multiple tools |
| Comprehensive Visualization Platforms | Consulting teams needing diverse diagram types with consistent styling | Broader capabilities, integration with existing tools, enterprise features |
| Document-Integrated Solutions | Organizations creating comprehensive client deliverables | Seamless integration with documents, slides, and other content types |
When evaluating tools, I recommend prioritizing:
- Quality and precision of diagram generation
- Flexibility in output formats and styling options
- Integration capabilities with your existing tool ecosystem
- Enterprise-grade security and privacy features
- Collaboration capabilities for team-based work
Converting Existing Diagrams
A practical first step is to convert your most frequently used diagrams to text-based generation. This approach allows you to:
- Create a library of proven, effective prompts
- Establish baseline quality standards
- Identify any limitations or challenges specific to your diagram types
- Build confidence in the technology through familiar examples
I recommend starting with simpler diagrams and progressively moving to more complex ones as you refine your prompt engineering skills.
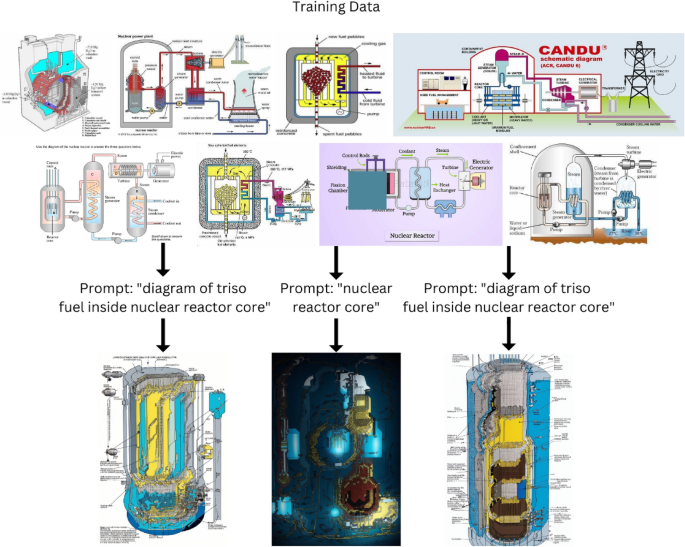
Comparison of manual diagram and its AI-generated equivalent
Building a Prompt Library
One of the most valuable assets I've created is a library of proven prompts for common consulting frameworks. This library includes:
Strategic Frameworks
- • SWOT Analysis template
- • Porter's Five Forces model
- • Growth-share matrix
- • Value chain visualization
Process Visualizations
- • Customer journey maps
- • Service blueprints
- • Decision trees
- • Process optimization flows
Organizational Structures
- • Team organization charts
- • Responsibility matrices
- • Stakeholder maps
- • Governance models
Implementation Planning
- • Roadmap templates
- • Risk assessment matrices
- • Resource allocation models
- • Change management frameworks
Each template in my library includes:
- The base prompt structure with placeholders for client-specific information
- Style specifications that align with our brand guidelines
- Common variations for different client contexts or industries
- Notes on typical refinements needed after generation
Measuring Time Savings and Quality Improvements
To quantify the impact of implementing AI diagram tools, I track several key metrics:
- Time efficiency: Average time saved per diagram (typically 80-90% reduction)
- Iteration velocity: Number of design iterations possible within project timelines
- Consistency score: Adherence to visual standards across multiple documents
- Client feedback: Qualitative assessment of diagram clarity and effectiveness
These metrics have helped me demonstrate the ROI of AI diagram tools and secure broader adoption within my organization.
Creating a Feedback Loop
To continuously improve diagram outputs, I've established a systematic feedback process:
flowchart LR
    A[Generate\nInitial Diagram] --> B[Collect\nStakeholder Feedback]
    B --> C[Refine\nPrompt Structure]
    C --> D[Update\nPrompt Library]
    D --> A
    style A fill:#FF8000,color:#fff
    style B fill:#FF8000,color:#fff
    style C fill:#FF8000,color:#fff
    style D fill:#FF8000,color:#fff
Continuous improvement cycle for AI-generated diagrams
This iterative approach ensures that our AI-generated diagrams continuously improve in quality and effectiveness, ultimately leading to better client outcomes and more efficient consulting processes.
Transform Your Visual Expressions with PageOn.ai
Ready to revolutionize how you create consulting-quality diagrams? PageOn.ai's powerful text-to-diagram capabilities can help you communicate complex ideas with clarity and impact in seconds, not hours.
Start Creating with PageOn.ai TodayConclusion: The New Era of Diagram Creation
As I've explored throughout this guide, AI-powered text-to-diagram tools have fundamentally transformed how consulting professionals create visual assets. The ability to generate professional-grade diagrams in seconds through natural language commands represents a paradigm shift in efficiency and accessibility.
The benefits extend beyond mere time savings. These tools democratize the creation of high-quality visualizations, allowing consultants to focus on strategic thinking rather than diagram design. They enable real-time visualization during client interactions, facilitating more dynamic and responsive engagements.
As the technology continues to evolve, I'm particularly excited about PageOn.ai's innovative approach to visual communication. By combining powerful text-to-diagram capabilities with enterprise-grade features like Deep Search and AI Blocks, PageOn.ai is setting a new standard for consulting visualization tools.
Whether you're creating strategic frameworks, process flows, data visualizations, or organizational structures, the techniques and approaches outlined in this guide will help you leverage AI-powered diagram tools to their fullest potential. The result? More compelling visual narratives, more efficient workflows, and ultimately, better client outcomes.
You Might Also Like
Revolutionizing Slides: The Power of AI Presentation Tools | PageOn.ai
Discover how AI presentation tools are transforming slide creation, saving hours of work while enhancing design quality. Learn how PageOn.ai can help visualize your ideas instantly.
The Creative Edge: Harnessing Templates and Icons for Impactful Visual Design
Discover how to leverage the power of templates and icons in design to boost creativity, not restrict it. Learn best practices for iconic communication and template customization.
The Art of Data Storytelling: Creating Infographics That Captivate and Inform
Discover how to transform complex data into visually compelling narratives through effective infographic design. Learn essential techniques for enhancing data storytelling with visual appeal.
Enhancing Audience Experience with Strategic Audio Integration | Create Immersive Brand Connections
Discover how strategic audio integration creates immersive brand connections across podcasts, streaming platforms, and smart speakers. Learn frameworks and techniques to transform your marketing.
