How to Create Functional Decomposition Diagrams: A Step-by-Step Visual Guide
Master the art of breaking down complex systems into manageable, visual components
I've found that visualizing complex systems becomes much easier when using functional decomposition diagrams. In this guide, I'll walk you through the process of creating these powerful visual tools, from understanding their basic principles to implementing advanced techniques that will help you analyze and communicate system functionality with clarity and precision.
Understanding Functional Decomposition Diagrams
When I first encountered complex systems analysis, I discovered that functional decomposition diagrams were invaluable tools for breaking down intricate processes into manageable parts. These diagrams serve as visual representations that systematically break down complex systems into their component functions.
At their core, these diagrams showcase hierarchical relationships between main functions and their sub-functions. I've found them particularly useful for managing complexity by dividing systems into analyzable, independent parts that can be understood individually and in relation to the whole.
The real power of functional decomposition diagrams lies in how they reveal dependencies and connections between various system components. This makes them exceptionally valuable for system analysis, problem-solving, and project planning activities where understanding the complete picture is crucial.
Key Insight: Functional decomposition diagrams help us understand not just what a system does, but how its various functions relate to and support each other in a hierarchical structure.
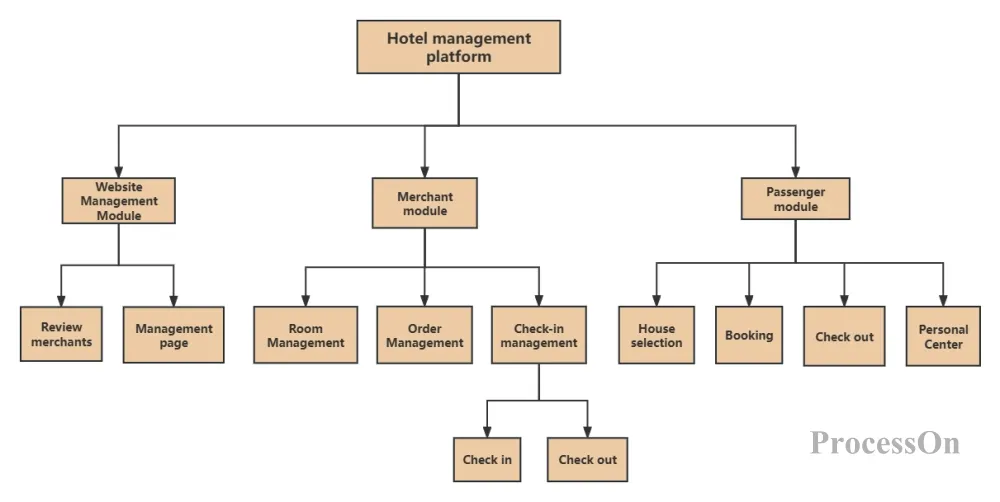
Essential Elements of Functional Decomposition Diagrams
In my experience creating these diagrams, I've found that understanding the core elements is crucial for effective visualization. Let's explore the building blocks that make up a functional decomposition diagram:
Functional Modules
The primary components of any functional decomposition diagram are the functional modules, represented as rectangular boxes. Each module represents a distinct function or component within the system. When creating these modules, I always ensure they have clear, action-oriented descriptions in verb + noun format (e.g., "Process Orders" rather than "Order Processing").
A critical aspect I've learned is to focus on what functions do, not how they do it. This distinction helps maintain the right level of abstraction and keeps the diagram focused on functional relationships rather than implementation details.
Connection Lines
Connection lines are vertical lines showing hierarchical relationships between functions. In my diagrams, these lines clearly demonstrate how sub-functions support and contribute to higher-level functions. The visual flow from top to bottom creates an intuitive understanding of how the system breaks down into progressively more detailed components.
Hierarchical Structure
The overall organization follows a hierarchical structure with a top-level function representing the overall system purpose. As I work downward, I progressively break functions into smaller, more specific sub-functions until reaching bottom-level functions that cannot be further decomposed.
Below is a visualization of the essential elements that make up a functional decomposition diagram:
graph TD
    A["Main Function
(System Purpose)"] --> B["Primary Sub-Function 1"]
    A --> C["Primary Sub-Function 2"]
    A --> D["Primary Sub-Function 3"]
    B --> B1["Secondary Sub-Function 1.1"]
    B --> B2["Secondary Sub-Function 1.2"]
    C --> C1["Secondary Sub-Function 2.1"]
    C --> C2["Secondary Sub-Function 2.2"]
    D --> D1["Secondary Sub-Function 3.1"]
    style A fill:#FF8000,stroke:#333,stroke-width:2px
    style B fill:#FFB266,stroke:#333,stroke-width:1px
    style C fill:#FFB266,stroke:#333,stroke-width:1px
    style D fill:#FFB266,stroke:#333,stroke-width:1px
Understanding these core elements has helped me create clear, effective functional decomposition diagrams that accurately represent system structures and relationships. The consistency in these elements makes the diagrams accessible and comprehensible to stakeholders across different disciplines.
Step-by-Step Creation Process
Based on my experience, creating an effective functional decomposition diagram involves a systematic approach. I'll guide you through each step of the process I follow when building these diagrams from scratch.
A. Identify the Main Function
I always start by determining the overall purpose of the system in a single, concise statement. This becomes the top-level function that sits at the peak of the diagram. When identifying this function, I focus on capturing the essence of what the system does, not how it works.
For example, if I'm analyzing a library management system, the main function might be "Manage Library Resources" rather than something implementation-specific like "Run Library Database Software."
B. Break Down into Primary Sub-Functions
Next, I identify 3-7 major functions that directly support the main function. These become the primary branches of my diagram. I arrange these horizontally below the main function and connect each to the main function with vertical lines.
For clarity, I always use verb-noun pairs in these function descriptions. For instance, "Process Orders" rather than "Order Processing" or just "Orders."

C. Continue Decomposition
With the primary structure in place, I continue breaking each primary sub-function into its own sub-functions. This process continues until I reach basic functions that cannot be meaningfully divided further. Throughout this process, I strive to maintain a consistent level of detail across each hierarchical tier.
One technique I've found helpful is to ask "how" questions about each function. For example, if a function is "Validate User," I ask "How do we validate the user?" The answers become the sub-functions: "Check Credentials," "Verify Permissions," etc.
D. Review and Refine
The final step in my process is thorough review and refinement. I check for missing functions or connections, ensure logical flow and organization, and validate that the diagram accurately represents the complete system. This often involves collaboration with subject matter experts to ensure nothing has been overlooked.
The diagram below illustrates the progressive decomposition process:
graph TD
    A["Step 1: Identify
Main Function"] --> B["Step 2: Break Down
into Primary Sub-Functions"]
    B --> C["Step 3: Continue
Decomposition"]
    C --> D["Step 4: Review
and Refine"]
    style A fill:#FF8000,stroke:#333,stroke-width:2px
    style B fill:#FFB266,stroke:#333,stroke-width:1px
    style C fill:#FFCC99,stroke:#333,stroke-width:1px
    style D fill:#FFE5CC,stroke:#333,stroke-width:1px
    subgraph "Example"
        E["Manage Library
Resources"] --> F["Process User
Accounts"]
        E --> G["Manage Book
Inventory"]
        F --> H["Register
New Users"]
        F --> I["Update User
Information"]
        G --> J["Add New
Books"]
        G --> K["Track Book
Location"]
    end
Following this step-by-step approach has consistently helped me create clear, comprehensive functional decomposition diagrams that accurately capture system functionality at multiple levels of detail.
Tools and Techniques for Creating Effective Diagrams
Over the years, I've experimented with various tools and techniques to create functional decomposition diagrams. The right combination of software and best practices can significantly enhance both the process and the final result.
Digital Tools Options
When selecting tools for creating functional decomposition diagrams, I consider factors like ease of use, collaboration capabilities, and export options. Here are some options I've found particularly effective:
Comparison of popular diagramming tools based on key features:
I've found that dedicated diagramming tools like Visio, Lucidchart, or draw.io offer robust features specifically designed for creating structured diagrams. For collaborative work, platforms like FigJam or PageOn.ai provide excellent real-time collaboration capabilities.
While general-purpose tools like Word or PowerPoint can work in a pinch, they often have limitations when it comes to creating and maintaining complex diagrams. I've found that the investment in learning a dedicated diagramming tool pays dividends in efficiency and quality.
Best Practices for Visual Clarity
Beyond tool selection, I follow these best practices to ensure my functional decomposition diagrams are clear and effective:
- Maintain consistent box sizes within each level to reinforce the hierarchical structure
- Use clear, readable fonts that remain legible even when diagrams are scaled down
- Implement color coding for different functional categories to enhance visual organization
- Balance whitespace and diagram elements to prevent visual clutter
- Consider using MCP component diagrams techniques for more complex systems
Pro Tip: I've found that using PageOn.ai's AI Blocks feature dramatically speeds up the initial structuring and organization of diagram elements. The AI can suggest logical groupings and hierarchies based on your system description, giving you a solid starting point that you can then refine.
By combining the right tools with these visual clarity best practices, I've been able to create functional decomposition diagrams that are not only accurate but also visually appealing and easy to understand.
Common Applications and Use Cases
Throughout my career, I've applied functional decomposition diagrams across various domains and found them valuable in numerous contexts. Understanding these common applications can help you identify opportunities to leverage this powerful visualization technique.
Software Development
In software development, I regularly use functional decomposition to break down complex applications into manageable modules. This approach helps in planning system architecture and understanding component relationships before coding begins.
One particularly valuable application is identifying potential areas for code reuse or optimization. By visualizing the functional structure, common patterns often emerge that might not be obvious when looking at requirements or user stories alone.

Business Process Analysis
When analyzing business processes, I've found functional decomposition invaluable for documenting as-is and to-be processes. The hierarchical breakdown helps identify redundancies and improvement opportunities that might be obscured in linear process flows.
These diagrams are also excellent for clarifying roles and responsibilities, as functions can be color-coded or tagged to indicate ownership or accountability. This visual mapping of functions to roles often reveals gaps or overlaps in responsibility.
Project Management
In project management contexts, I use functional decomposition as the foundation for work breakdown structures. The hierarchical nature of the diagram translates naturally to task allocation and resource planning.
The diagram also serves as an excellent tool for progress tracking and dependency management. By marking completed functions or highlighting bottlenecks, the team gains a visual understanding of project status and critical paths.
Problem-Solving
For complex problem-solving scenarios, I've applied functional decomposition for root cause analysis, breaking down systems to identify where failures or inefficiencies originate. Similarly, when designing solutions, the diagram helps ensure all necessary functions are addressed in the proposed approach.
System troubleshooting and optimization efforts benefit greatly from this structured approach, as it allows methodical examination of each functional component to identify improvement opportunities.
Effectiveness of functional decomposition diagrams across different domains:
By understanding these diverse applications, I've been able to apply functional decomposition diagrams across multiple disciplines, adapting the technique to address specific challenges while maintaining its core principles.
Advanced Techniques and Considerations
As I've become more experienced with functional decomposition diagrams, I've developed advanced techniques that enhance their effectiveness and address common challenges. These approaches can help you take your diagrams to the next level.
Integration with Other Diagrams
I've found great value in understanding how functional decomposition complements other diagram types. For instance, while functional decomposition shows the hierarchical breakdown of system functions, data flow diagrams illustrate how information moves between these functions. Using both provides a more complete system view.
Similarly, I often connect functional decomposition to use case diagrams and user stories to ensure that technical functions align with user needs. This multi-diagram approach creates a comprehensive visualization ecosystem that addresses different aspects of system understanding.
Understanding the relationship with process flow charts is also valuable. While process flows show sequential steps, functional decomposition reveals the hierarchical structure. I often use both in tandem, with functional decomposition providing the "what" and process flows showing the "how" and "when."
How functional decomposition relates to other diagram types:
graph TD
    A["Functional
Decomposition
Diagram"] -->|complements| B["Data Flow
Diagram"]
    A -->|aligns with| C["Use Case
Diagram"]
    A -->|provides structure for| D["Process
Flowchart"]
    A -->|informs| E["Class
Diagram"]
    B -->|shows data movement
between functions| A
    C -->|connects user needs
to functions| A
    D -->|shows sequential
execution of functions| A
    E -->|implements functions
as methods| A
    style A fill:#FF8000,stroke:#333,stroke-width:2px
    style B fill:#42A5F5,stroke:#333,stroke-width:1px
    style C fill:#66BB6A,stroke:#333,stroke-width:1px
    style D fill:#EF5350,stroke:#333,stroke-width:1px
    style E fill:#AB47BC,stroke:#333,stroke-width:1px
Avoiding Common Pitfalls
Through trial and error, I've identified several common pitfalls in functional decomposition and developed strategies to avoid them:
- Excessive Detail: I'm careful to prevent excessive detail that obscures understanding. Each level should have approximately 3-7 sub-functions—too many indicates a need for an intermediate grouping level.
- Scope Boundaries: Maintaining appropriate scope boundaries is essential. I clearly define what's in and out of scope at the beginning to prevent the diagram from expanding uncontrollably.
- Consistent Abstraction: Ensuring consistent abstraction levels across each tier helps maintain diagram clarity. I check that all functions at the same level have similar granularity.
- Cross-Cutting Concerns: Handling cross-cutting concerns and shared functions can be challenging. I use visual cues like dotted lines or color coding to show when a function supports multiple higher-level functions.
Understanding these pitfalls has helped me create more effective diagrams and guide others in avoiding common mistakes that can diminish diagram value.
Iterative Refinement Approach
I've found that an iterative approach yields the best results. I start with high-level functions and progressively add detail, rather than trying to create the perfect diagram in one sitting. This allows the diagram to evolve as understanding deepens.
Collaborative review is essential to this process. I regularly share drafts with stakeholders and team members to gather feedback and incorporate diverse perspectives. This not only improves the diagram but also builds shared understanding.
Using PageOn.ai's Deep Search feature has been particularly valuable for integrating relevant examples and best practices. I can quickly find similar diagrams or industry standards to inform my approach, ensuring I leverage established patterns when appropriate.
Advanced Tip: When working with complex systems, I create multiple levels of functional decomposition diagrams—a high-level overview for executives and stakeholders, and more detailed versions for implementation teams. This multi-level approach ensures everyone has the right level of detail for their needs.
These advanced techniques have helped me create more sophisticated, accurate, and useful functional decomposition diagrams that provide genuine value in complex projects and system analysis efforts.
Practical Example: Building a Library Management System Diagram
Let me walk you through a concrete example based on my experience creating a functional decomposition diagram for a library management system. This practical illustration demonstrates the concepts and techniques we've discussed.
Top-Level Function
I started by identifying the top-level function: "Manage Library Resources." This captures the overall purpose of the system without specifying implementation details. It focuses on what the system does, not how it does it.
Primary Sub-Functions
Next, I identified the primary sub-functions that directly support the main function:
- Process User Accounts
- Manage Book Inventory
- Handle Lending Operations
- Generate Reports
- Maintain System Administration
Library Management System - Top-Level Functional Decomposition:
graph TD
    A["Manage Library
Resources"] --> B["Process User
Accounts"]
    A --> C["Manage Book
Inventory"]
    A --> D["Handle Lending
Operations"]
    A --> E["Generate
Reports"]
    A --> F["Maintain System
Administration"]
    style A fill:#FF8000,stroke:#333,stroke-width:2px
    style B fill:#FFB266,stroke:#333,stroke-width:1px
    style C fill:#FFB266,stroke:#333,stroke-width:1px
    style D fill:#FFB266,stroke:#333,stroke-width:1px
    style E fill:#FFB266,stroke:#333,stroke-width:1px
    style F fill:#FFB266,stroke:#333,stroke-width:1px
Detailed Breakdown Example
I then continued the decomposition process for each primary sub-function. Let's look at the detailed breakdown for "Process User Accounts":
Detailed breakdown of "Process User Accounts" function:
graph TD
    A["Process User
Accounts"] --> B["Register New
Users"]
    A --> C["Update User
Information"]
    A --> D["Track User
Activity"]
    A --> E["Manage User
Permissions"]
    B --> B1["Collect User
Details"]
    B --> B2["Verify User
Identity"]
    B --> B3["Create User
Account"]
    C --> C1["Edit Profile
Information"]
    C --> C2["Update Contact
Details"]
    C --> C3["Change User
Status"]
    D --> D1["Record Borrowing
History"]
    D --> D2["Track Overdue
Items"]
    D --> D3["Monitor Search
Patterns"]
    E --> E1["Assign User
Roles"]
    E --> E2["Set Borrowing
Limits"]
    E --> E3["Manage Access
Restrictions"]
    style A fill:#FF8000,stroke:#333,stroke-width:2px
    style B fill:#FFB266,stroke:#333,stroke-width:1px
    style C fill:#FFB266,stroke:#333,stroke-width:1px
    style D fill:#FFB266,stroke:#333,stroke-width:1px
    style E fill:#FFB266,stroke:#333,stroke-width:1px
I continued this process for each primary sub-function, maintaining consistent detail levels across the diagram. This created a comprehensive view of the entire library management system's functionality.
Visualization Tips
When creating this diagram, I leveraged several techniques to enhance clarity and usability:
- Used consistent color coding to differentiate function levels (darker orange for higher-level functions, lighter for lower levels)
- Maintained uniform box sizes within each level to reinforce the hierarchical structure
- Added brief descriptions within each function box to clarify purpose
- Used PageOn.ai's types of diagrams reference to ensure I was following best practices for functional decomposition
- Incorporated flowchart symbols where appropriate to indicate decision points or processes
Using PageOn.ai's Vibe Creation feature significantly accelerated this process. I simply provided a description of the library management system, and the AI suggested a complete diagram structure that I could then refine and customize. This gave me a solid starting point and saved hours of initial setup time.
The AI Blocks feature was particularly helpful for organizing and rearranging functional components. When I needed to restructure part of the diagram, I could quickly select and move entire functional groups while maintaining their internal relationships, ensuring optimal clarity in the final visualization.
This practical example demonstrates how the principles and techniques we've discussed can be applied to create a comprehensive, clear functional decomposition diagram for a real-world system.
Transform Your Visual Expressions with PageOn.ai
Ready to create stunning functional decomposition diagrams that bring clarity to complex systems? PageOn.ai's intuitive interface and AI-powered features make it easy to build professional diagrams in minutes, not hours.
Bringing Clarity to Complexity
Throughout my experience with functional decomposition diagrams, I've come to appreciate their power in bringing clarity to complex systems. By breaking down intricate processes into manageable, hierarchical components, these diagrams make the incomprehensible comprehensible.
The step-by-step approach I've outlined—from identifying the main function to reviewing and refining the complete diagram—provides a systematic way to create these valuable visual tools. When combined with the right software and best practices, functional decomposition becomes an essential technique in any analyst's or designer's toolkit.
I encourage you to apply these techniques in your own work, whether you're developing software, analyzing business processes, managing projects, or solving complex problems. With practice, you'll develop your own insights and refinements to the process.
And remember, tools like PageOn.ai can significantly streamline the creation process, allowing you to focus on the content and insights rather than the mechanics of diagram creation. By leveraging AI-powered features for initial structure and organization, you can create professional, insightful functional decomposition diagrams that communicate complex ideas with remarkable clarity.
You Might Also Like
Beyond The Pitch: Visualizing Startup Traction Metrics That Win VC Funding
Discover the essential startup traction metrics that venture capitalists truly value. Learn how to visualize growth, efficiency, and revenue metrics to secure funding for your startup.
Legal Interpretation Theory: From Textual Analysis to Visual Meaning-Making | PageOn.ai
Explore the evolution of legal interpretation theory from strict textualism to constructive meaning-making, and discover how visual tools transform complex legal reasoning into accessible frameworks.
Creating Interactive and Animated Infographics for Enhanced User Engagement
Discover how to transform data into captivating interactive stories through animated infographics. Learn best practices, technical approaches, and tools for creating engaging visual experiences.
Mastering Investor Communication: Angel to Series C Fundraising Visuals
Learn how to adapt your fundraising visual strategy from Angel to Series C. Discover stage-specific investor communication techniques and create compelling fundraising materials.