Mastering Infographic Design: Principles, Styles, and Examples That Transform Complex Data
The Anatomy of Effective Infographics
I've spent years studying how visual information transforms the way we consume and retain knowledge. In this comprehensive guide, I'll walk you through the essential elements of effective infographic design, showcase diverse styles that work for different contexts, and provide practical examples that you can apply to your own visual communication projects.
The Anatomy of Effective Infographics
When I create infographics, I always start by understanding the fundamental elements that make them powerful communication tools. Effective infographics aren't just about making information look pretty—they're about striking the perfect balance between visual appeal and information clarity.

In my experience, the most effective infographics share these core elements:
- Clear hierarchy: Guiding the viewer's eye through information in a logical sequence
- Focused message: Communicating a single, coherent story or argument
- Visual consistency: Maintaining unified style elements throughout the design
- Data integrity: Representing information accurately without distortion
Different industries utilize infographics for distinct communication goals. Healthcare organizations often use them to simplify complex medical information, while financial institutions leverage infographics to make numerical data more digestible. Tech companies frequently use them to explain processes or product features.
The Psychology Behind Infographic Effectiveness
I've studied how our brains process visual information, and the research is compelling. We process visual information 60,000 times faster than text, and we retain 80% of what we see compared to just 20% of what we read.
This is why well-designed infographics dramatically improve information retention—they tap into our brain's preference for visual processing.
When designing infographics, I always consider how different visual elements work together to create a cohesive narrative. The most successful infographics don't just present data—they tell a story that resonates with the audience on both intellectual and emotional levels.
Compelling Infographic Design Styles Worth Exploring
In my years of designing infographics, I've found that different styles serve different purposes. Let's explore some of the most effective approaches I've used and how you can implement them in your own designs.
Line Art Infographics

I love line art infographics for their elegant simplicity. This style uses minimal design elements to create clean data representation, making it perfect for technical or data-heavy topics. The reduced visual noise allows viewers to focus entirely on the information.
Some of the most successful line art infographics I've seen maintain simplicity while conveying complex information through:
- Consistent line weights throughout the design
- Limited color palette (often monochromatic with one accent color)
- Simple iconography that avoids unnecessary detail
- Strategic use of negative space
When I implement this style with infographic design tools like PageOn.ai's AI Blocks, I focus on creating modular components that maintain visual consistency while allowing for complex information architecture.
Photo-Based Infographics

Photo-based infographics bring an immediate real-world connection to data visualization. I've found that when working with photographs in infographics, proper cropping and framing are essential to enhance rather than distract from the information.
For serious topics, I often create newspaper-style black-and-white infographics that lend gravity and historical context to the information. This approach works particularly well for social issues, historical data, or journalistic content.
One of my favorite techniques is using tinted images as backgrounds with chart overlays for contextual enhancement. For example, when creating an infographic about urban development, placing transparent charts over a cityscape immediately establishes the subject matter.
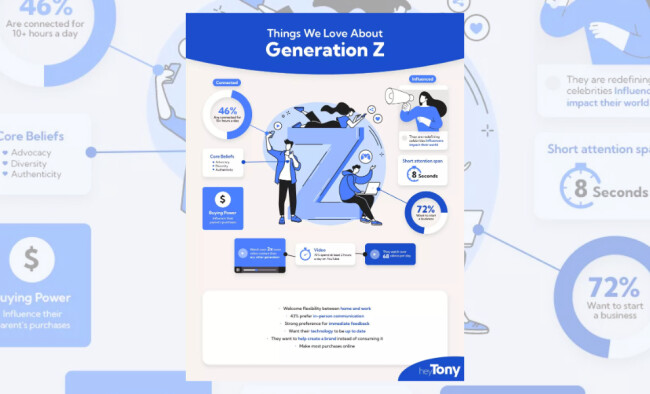
Modern Minimalist Designs

The modern minimalist approach has become my go-to style for many projects. This design philosophy utilizes solid color images against white backdrops, creating a clean, contemporary feel that works especially well for tech and business contexts.
When I create minimalist infographics, I focus on:
- Creating breathing room through strategic white space
- Using a restricted color palette (often just 2-3 colors)
- Employing simple geometric shapes and icons
- Balancing text and visuals for maximum impact
This approach allows me to create stunning infographics that communicate clearly without overwhelming the viewer with unnecessary decorative elements.
Design Principles That Elevate Infographic Quality
Through my experience creating hundreds of infographics, I've identified several design principles that consistently elevate the quality and effectiveness of visual information. These principles apply regardless of the specific style you choose.
Visual Balance and Cohesion

I always pay careful attention to visual balance when designing infographics. A balanced design keeps the entire composition cohesive—especially in long-form infographics where maintaining viewer interest from top to bottom is crucial.
When I work on vertical infographics, I ensure there's a natural flow from top to bottom by:
- Distributing visual weight effectively throughout the design
- Creating rhythm through repeating elements
- Using consistent visual language across all sections
- Employing directional cues to guide the eye
PageOn.ai's Vibe Creation feature has been invaluable for maintaining consistent visual language across complex infographics. It helps me establish a unified look and feel that makes the information feel cohesive even when covering diverse aspects of a topic.
Color Psychology in Infographic Design
Color selection is one of the most powerful tools in my infographic design arsenal. I always select color schemes that match my topic's mood and setting—using warm colors for energetic topics and cool colors for more analytical content.
When designing infographics for visual presentation examples, I consider these color principles:
- Creating accessible color combinations with sufficient contrast
- Using color to establish visual hierarchy and guide attention
- Limiting the palette to 3-5 colors for cohesion
- Employing color consistently to represent specific data categories
I've found that using color to highlight key data points creates immediate visual hierarchy, drawing the viewer's attention to the most important information first.
Typography Strategies

Typography plays a crucial role in how information is consumed in infographics. I carefully select fonts that enhance readability while reinforcing the message and tone of the content.
My approach to typography in infographics includes:
- Creating clear typographic hierarchy with distinct styles for titles, subtitles, body text, and captions
- Limiting the design to 2-3 font families maximum
- Ensuring sufficient contrast between text and background
- Using font size, weight, and style to establish information importance
I find that balancing decorative and functional text elements is essential—decorative typography works well for headlines and key statistics, while more conservative choices are better for body text and detailed information.
From Concept to Completion: The Infographic Creation Process
Creating effective infographics requires a structured approach. I've refined my process over years of professional design work, and I'd like to share the key steps I follow to ensure my infographics are both visually compelling and informationally sound.
flowchart TD
    A[Research & Data Collection] --> B[Story Development]
    B --> C[Visual Concept & Sketching]
    C --> D[Design & Layout Creation]
    D --> E[Content Integration]
    E --> F[Review & Refinement]
    F --> G[Finalization & Publishing]
    style A fill:#FF8000,color:white
    style B fill:#FF9A3D,color:white
    style C fill:#FFB067,color:white
    style D fill:#FFC78E,color:white
    style E fill:#FFDDB5,color:black
    style F fill:#FFF4E6,color:black
    style G fill:#FFFFFF,stroke:#FF8000,color:black
Starting with Strong Research
Every great infographic I create begins with thorough research. I focus on:
- Gathering and organizing data that tells a compelling story
- Identifying key statistics and insights worth highlighting
- Finding connections between data points to create narrative flow
- Verifying information accuracy from multiple sources
I've found that PageOn.ai's Deep Search feature dramatically streamlines this research phase by helping me find relevant supporting visuals and data that enhance my infographic's credibility and impact.
Crafting Compelling Titles and Headlines

The title of an infographic is its first impression. I spend considerable time crafting titles that are both catchy and descriptive, using techniques like:
- Including numbers when relevant (e.g., "7 Proven Strategies...")
- Using strong action verbs to create energy
- Incorporating intriguing questions or statements
- Keeping titles concise while communicating clear value
For section headers within infographics, I create a system that guides readers through the narrative while maintaining visual consistency. Each header clearly signals a new information category while supporting the overall story.
Determining the Optimal Structure
flowchart LR
    subgraph Vertical
    V1[Long-form storytelling] --- V2[Sequential information]
    V2 --- V3[Mobile-friendly]
    end
    subgraph Horizontal
    H1[Timeline visualization] --- H2[Process flows]
    H2 --- H3[Comparative data]
    end
    subgraph Interactive
    I1[Complex data exploration] --- I2[User engagement]
    I2 --- I3[Multiple information layers]
    end
    Vertical -.-> Choice[Layout Choice]
    Horizontal -.-> Choice
    Interactive -.-> Choice
    style Choice fill:#FF8000,color:white
    style Vertical fill:#FFF4E6,stroke:#FF8000
    style Horizontal fill:#FFF4E6,stroke:#FF8000
    style Interactive fill:#FFF4E6,stroke:#FF8000
Selecting the right structure for an infographic is critical to its success. When I'm designing interactive infographics, I consider factors like:
- Content complexity and volume
- Primary distribution channels (social media, website, print)
- Target audience's typical consumption habits
- The natural flow of the information narrative
I map the information flow for intuitive consumption, ensuring logical progression of ideas throughout the design. This planning stage is crucial for creating infographics that guide viewers effortlessly through complex information.
Industry-Specific Infographic Examples and Applications
Different industries have unique visualization needs and effective approaches. I've created infographics across many sectors, and I'd like to share some industry-specific insights and examples.
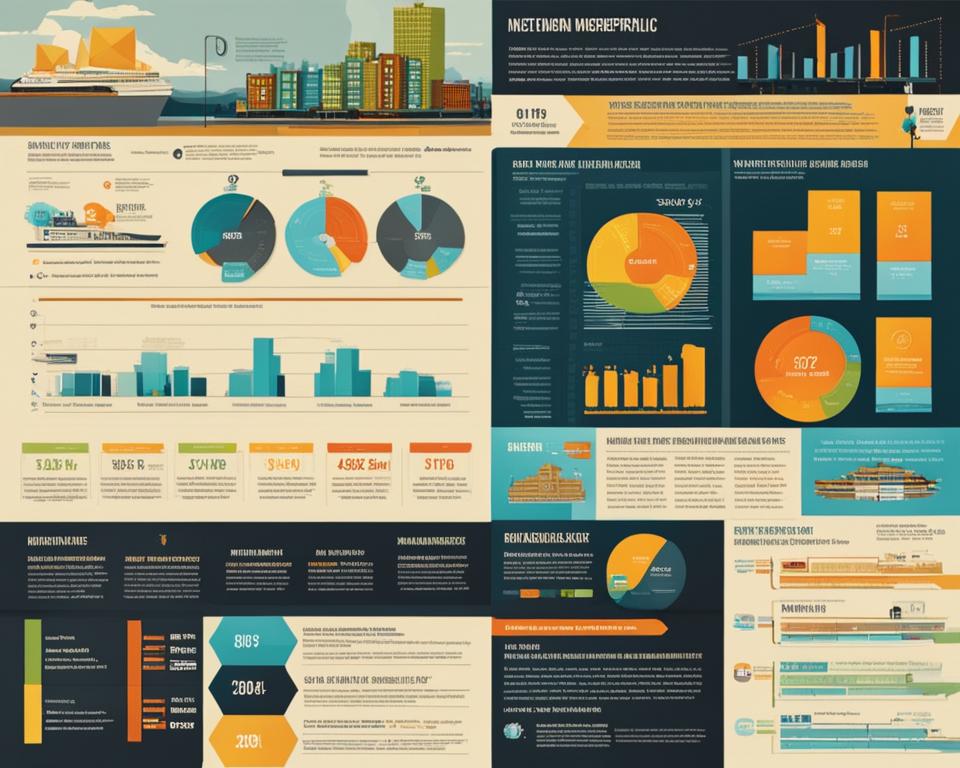
Data Visualization for Business Intelligence

In the business intelligence sector, I focus on translating complex metrics into accessible visual formats that executives and decision-makers can quickly understand and act upon.
One particularly effective example I've studied is the "City Startup Scores" infographic, which brilliantly uses contextual imagery. By overlaying startup performance metrics on city skylines, it immediately establishes location context while presenting comparative data clearly.
When creating business infographics, I employ techniques like:
- Using consistent scales when presenting comparative data
- Incorporating executive summaries for key insights
- Creating visual hierarchies that prioritize actionable metrics
- Using contextual imagery that reinforces the business sector
These infographic data visualizations are particularly effective for quarterly reports, market analyses, and competitive landscape overviews.
Educational and Advocacy Infographics
Educational and advocacy infographics require a delicate balance between emotional impact and factual presentation. One notable example I've analyzed is the "Racism in Sports" infographic, which effectively uses black-and-white imagery to create a serious, documentary-like tone that suits the gravity of the subject.
When I create infographics for educational or advocacy purposes, I focus on:
- Simplifying complex social issues without oversimplifying nuance
- Using visual metaphors that create emotional connection
- Including clear calls to action when appropriate
- Ensuring data is presented honestly and in proper context
These principles help me create infographics that not only inform but also inspire action and deeper understanding of important social issues.
Health and Wellness Information Design

Health and wellness infographics require particular attention to clarity and accessibility. I've studied examples like the "Chicken Health With Herbs" infographic, which effectively uses natural imagery and clear organization to make health information approachable.
When designing health-related infographics, I prioritize:
- Using calming color schemes that inspire trust
- Creating clear visual connections between causes and effects
- Including anatomical or botanical illustrations when relevant
- Ensuring medical information is accurate and properly sourced
I've found that PageOn.ai's visualization tools are particularly valuable for transforming complex health concepts into clear visuals, especially when explaining bodily systems or treatment processes.
Tools and Techniques for Modern Infographic Creation
The tools and techniques available for infographic creation have evolved dramatically in recent years. I'd like to share some of the modern approaches I use to create more effective, engaging infographics.
Leveraging AI for Infographic Design
flowchart TD
    Start[Design Brief] --> AI[PageOn.ai Processing]
    AI --> Components[AI Blocks Generation]
    Components --> Assembly[Component Assembly]
    Assembly --> Refinement[Human Refinement]
    Refinement --> Final[Final Infographic]
    subgraph "AI Assistance"
    AI
    Components
    end
    subgraph "Human Creative Control"
    Assembly
    Refinement
    end
    style Start fill:#FFF4E6,stroke:#FF8000
    style AI fill:#FF8000,color:white
    style Components fill:#FF9A3D,color:white
    style Assembly fill:#FFB067,color:white
    style Refinement fill:#FFC78E,color:white
    style Final fill:#FFDDB5,color:black
AI tools have transformed my infographic creation process. PageOn.ai in particular has become an essential part of my workflow, allowing me to:
- Generate initial design concepts based on content themes
- Quickly assemble infographic components using AI Blocks
- Create variations to test different approaches
- Maintain creative control while accelerating the design process
The key advantage I've found with AI-assisted design is that it handles the time-consuming aspects of component creation, allowing me to focus on the strategic and creative decisions that truly elevate the final product.
Interactive and Animated Elements

I've increasingly incorporated interactive and animated elements into my infographics to boost engagement and allow for deeper data exploration. However, I'm careful about when and how to use these features.
My guidelines for effective animation in infographics include:
- Using motion to guide attention to key information
- Creating interactive elements that reveal additional data layers
- Ensuring animations have purpose rather than being merely decorative
- Maintaining information clarity as the primary goal
Interactive elements are particularly valuable for complex datasets where users benefit from exploring specific aspects in greater detail according to their interests.
Responsive Design Considerations
With more than 50% of web traffic coming from mobile devices, I always design infographics with responsive considerations in mind. This has become an essential part of my process.
My approach to responsive infographic design includes:
- Creating modular designs that maintain integrity when resized
- Ensuring text remains readable on smaller screens
- Adapting complex visuals for mobile viewing
- Testing designs across multiple devices and screen sizes
For social media sharing, I often create modified versions of infographics specifically optimized for each platform's unique requirements and audience viewing habits.
Measuring Infographic Success and Optimization
Creating beautiful infographics is only part of the equation—measuring their effectiveness and continuously improving is equally important. I've developed a systematic approach to evaluating and optimizing my infographic designs.
Defining Key Performance Indicators
When measuring infographic success, I look beyond simple view counts to more meaningful engagement metrics. My key performance indicators include:
- Social sharing rates compared to standard content
- Time spent viewing the infographic
- Click-through rates on embedded calls to action
- Conversion rates when infographics are part of a funnel
I regularly conduct A/B testing of different infographic approaches, comparing variations in layout, color schemes, typography, and content density to identify what resonates most with my target audience.
Common Pitfalls and How to Avoid Them
Through years of experience, I've identified several common pitfalls in infographic design and developed strategies to avoid them:
- Overcrowding: I've learned to recognize when content should be split into multiple infographics rather than cramming everything into one design.
- Data distortion: I'm careful to maintain data integrity while simplifying visualization, ensuring charts accurately represent proportional relationships.
- Accessibility issues: I design with color blindness and other visual impairments in mind, using tools to test how my infographics appear to different users.
- Lack of narrative: I ensure every infographic tells a coherent story rather than presenting disconnected data points.
By proactively addressing these common issues, I create infographics that are more effective and reach a wider audience.
Iterative Improvement Strategies
I approach infographic design as an iterative process that continuously improves through feedback and refinement. My improvement strategies include:
- Gathering user feedback through surveys and usability testing
- Analyzing heatmap data to see which parts of infographics receive the most attention
- Regularly updating infographics with new data to maintain relevance
- Using PageOn.ai's agentic capabilities to quickly generate variations for testing
This commitment to continuous improvement ensures my infographics become more effective over time, delivering better results for both my audience and my strategic goals.
Transform Your Visual Expressions with PageOn.ai
Ready to create stunning infographics that captivate your audience and communicate complex ideas with clarity? PageOn.ai's intuitive design tools and AI-powered assistance make professional-quality infographic creation accessible to everyone, regardless of design experience.
Start Creating with PageOn.ai TodayFinal Thoughts: The Future of Infographic Design
As I look to the future of infographic design, I'm excited by the possibilities that emerging technologies offer. AI-powered tools like PageOn.ai are democratizing design, making it possible for anyone to create professional-quality infographics without extensive design training.
The most effective infographics will continue to be those that balance aesthetic appeal with information clarity, telling compelling stories through thoughtful visual representation. As data becomes increasingly abundant and complex, the need for clear, engaging visual communication will only grow.
I encourage you to experiment with different styles and approaches in your own infographic designs. Start with the principles outlined in this guide, but don't be afraid to develop your unique visual voice. The most memorable infographics often break new ground while remaining faithful to fundamental design principles.
With tools like PageOn.ai at your disposal, you have everything you need to transform complex data into beautiful, effective visual stories that inform, engage, and inspire your audience.
You Might Also Like
Platform-Specific Infographic Formatting: Optimize for Social Media Success
Master platform-specific infographic formatting for Instagram, Pinterest, LinkedIn, Twitter & Facebook. Learn optimal dimensions, aspect ratios & design strategies for social media success.
Streamlined Visual Creation: The Essential Minimalist Creator's Toolkit That Actually Works
Discover how to build a truly minimalist creator's toolkit that delivers results. Learn to overcome creative bottlenecks and build sustainable workflows that boost productivity without sacrificing quality.
Beyond The Pitch: Visualizing Startup Traction Metrics That Win VC Funding
Discover the essential startup traction metrics that venture capitalists truly value. Learn how to visualize growth, efficiency, and revenue metrics to secure funding for your startup.
Strategic Icon Selection Guide: Achieving Visual Consistency in Design Systems
Learn how to create visual harmony through intentional icon systems. Our comprehensive guide covers selection criteria, styling guidelines, and implementation strategies for cohesive design.